Analyzing Satellite Radar Imagery with Deep Learning
By Kelley Dodge and Carl Howell, C-CORE
On average, some 500 icebergs enter the Newfoundland and Labrador offshore area each year, posing potential threats to shipping and marine operations. In the 1990s, companies began using satellite synthetic aperture radar (SAR) to monitor icebergs and sea ice. SAR is well suited to the task because it can capture images from large swaths of ocean both day and night, as well as through clouds, fog, and other adverse weather conditions.
Analysis of SAR images involves identifying targets (clusters of high-intensity pixels) in the image and categorizing them as either icebergs or ships (Figure 1). Even for highly trained specialists it can take hours to analyze a handful of frames, particularly when the targets are difficult to discern.
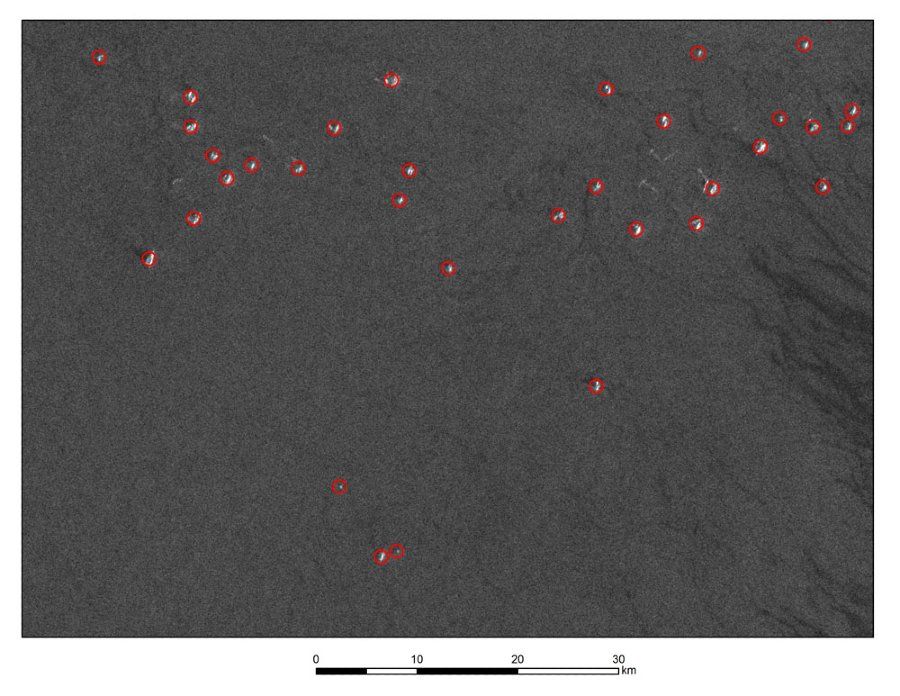
Figure 1. CAP modulation and demodulation scheme for a VLC system.
Our team at C-CORE has partnered with the Norwegian energy company Equinor to develop automated software that uses deep learning to classify targets in SAR images. We decided to harness the expertise of the worldwide community of AI researchers by hosting a Kaggle competition. We studied the best ideas from the competition, implemented them with convolutional neural networks (CNNs) in MATLAB®, and then built software that could be used operationally.
Challenges in Iceberg Identification
The resolution of a SAR image depends upon how much area the image covers: images that focus on relatively small regions have higher resolution than those that cover wide swaths of ocean and are therefore easier to classify (Figures 2 and 3). In practice, to extract the greatest amount of useful information from a dataset, we must work with images at all levels of resolution, even images with targets only a few pixels wide.
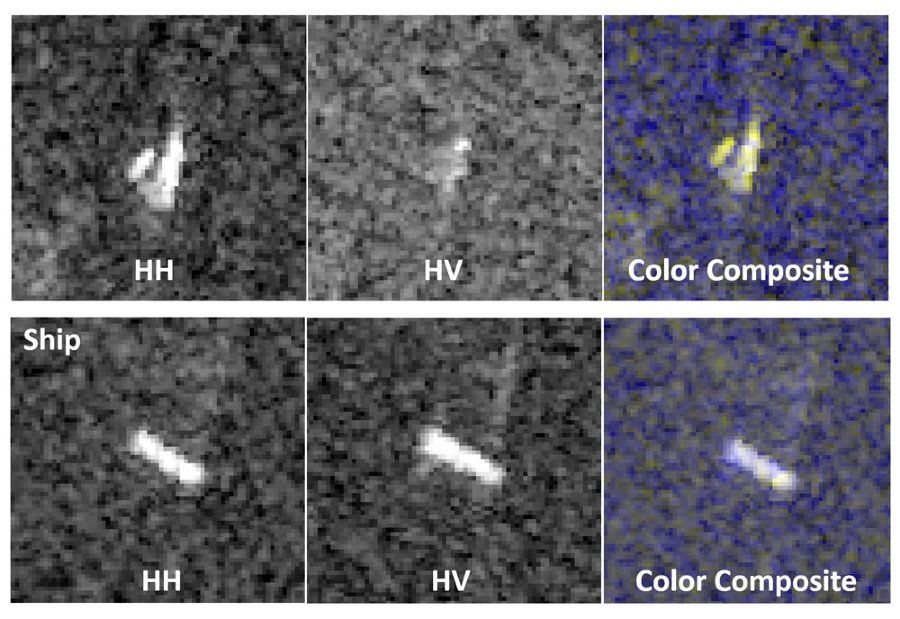
Figure 2. Color composite images of an easily classified iceberg (top right) and ship (bottom right) created from multiple polarization channels (labeled HH and HV).

Figure 3. Color composite images of iceberg (top right) and ship (bottom right) that are difficult to classify.
Before we began using deep learning, we used quadratic discriminant analysis for iceberg classification, but this involved segmenting the images to separate the target pixels from the background ocean pixels. Image segmentation was a challenge because ocean conditions vary widely, and the visual clutter caused by poor conditions made it difficult to define the contours of each target. With CNNs, there is no need to distinguish a target from its background, since the algorithms are trained on complete SAR chips, fixed-dimension images containing a single target.
The Kaggle Competition
Our Kaggle competition presented participants with a simple challenge: develop an algorithm capable of automatically classifying the target in a SAR image chip as either a ship or an iceberg. The dataset for the competition included 5000 images extracted from multichannel SAR data collected by the Sentinel-1 satellite along the coast of Labrador and Newfoundland (Figure 4). Our competition proved to be the most popular image-based competition ever hosted on Kaggle, with 3343 teams contributing more than 47,000 submissions.

Figure 4. SAR data collected by the Sentinel-1 satellite along the coast of Newfoundland and Labrador.
Adblu. “Statoil/C-CORE Iceberg Classifier Challenge: Ship or iceberg, can you decide from space?” Kaggle, 8 November 2017, https://www.kaggle.com/c/statoil-iceberg-classifier-challenge/discussion/42108
The best-performing entries all used deep learning. Their models shared many characteristics and layers, including convolution, rectified linear unit (ReLU), max pooling, and softmax layers. In addition, the top entries all used ensembles to boost prediction accuracy from about 92% to 97%.
Building Our Deep Learning Model with MATLAB
Using the top Kaggle entries as a starting point, we developed our own deep learning model with MATLAB and Deep Learning Toolbox™. We began by modifying a simple classifier provided in Deep Learning Toolbox. Within a few days we had a network that worked well.
To optimize network performance, we tested different combinations of parameter values, varying, for example, the number of nodes in each layer, the filter size used in the convolution layer, the pool size used in the max pooling layer, and so on. We wrote a MATLAB script that automatically built, trained, and tested 10,000 different CNNs, with values for these parameters randomly generated within reasonable limits and constraints.
We performed a simple greedy search on the results to find the seven highest-performing CNNs and used them to create an ensemble. Like the ensembles used by the Kaggle competition winners, our ensemble increased overall accuracy by almost 5%.
By working in MATLAB, within two weeks we went from knowing little about the implementation of CNN classifiers to producing a solution that performed well enough to be employed operationally.
Integrating the Classifier into a Complete System
Target discrimination is one step in a multistep process for iceberg identification. The process also involves land masking, to eliminate false detections caused by on-land objects, and integration with geographic information system software, to produce maps showing the locations of icebergs and ships (Figure 5).
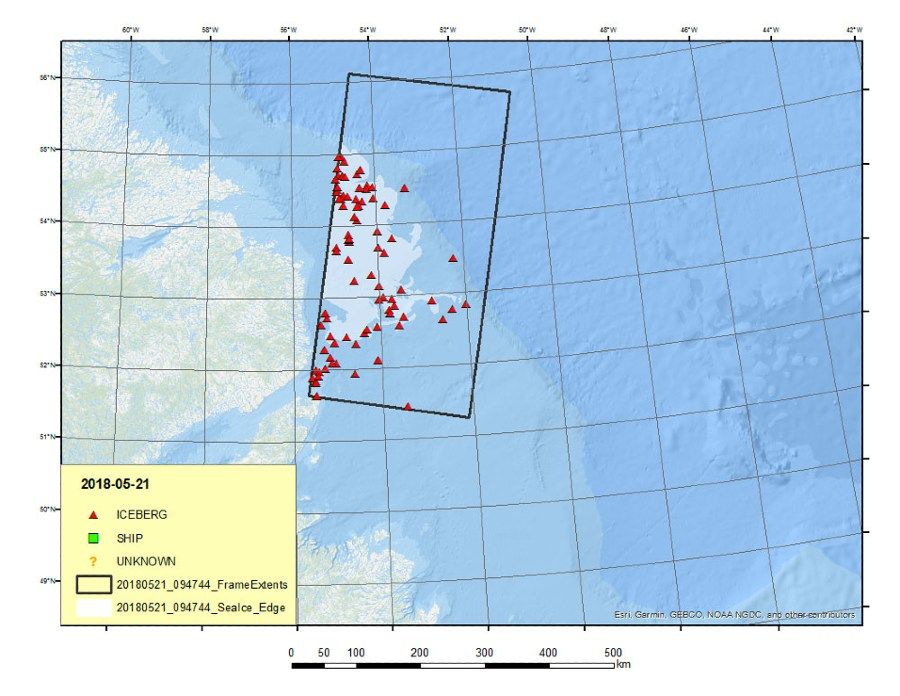
Figure 5. Iceberg locations plotted on a map.
When RADARSAT Constellation Mission satellites begin generating data this year, we will have access to even more SAR images—far too many for analysis via manual visual inspection. Software systems that incorporate deep learning algorithms like the ones we developed in MATLAB will enable C-CORE to make the most of this data by processing it accurately, quickly, and automatically.
Published 2019