Confirming the First-Ever Detection of Gravitational Waves by Analyzing Laser Interferometer Data
By Matthew Evans, MIT
At about 7 a.m. on September 14, 2015, I received an email from my colleagues in Europe notifying me of an extraordinary event: Two detectors in the Laser Interferometer Gravitational-Wave Observatory (LIGO) had simultaneously identified what appeared to be a transient gravitational-wave signal—a “ripple” in space-time.
As a member of the team that developed the LIGO instrumentation, I was excited but also slightly apprehensive. I was excited because if the signal was authentic, it would mark the first time that a gravitational wave had ever been directly observed, confirming Albert Einstein’s prediction of their existence, made a century ago. It would also mark the first observation of a pair of black holes merging to form a single black hole. My colleagues and I were apprehensive, however, because we did not yet know whether the signal came from a genuine gravitational wave or was merely the result of some error in the LIGO control system and instrumentation.
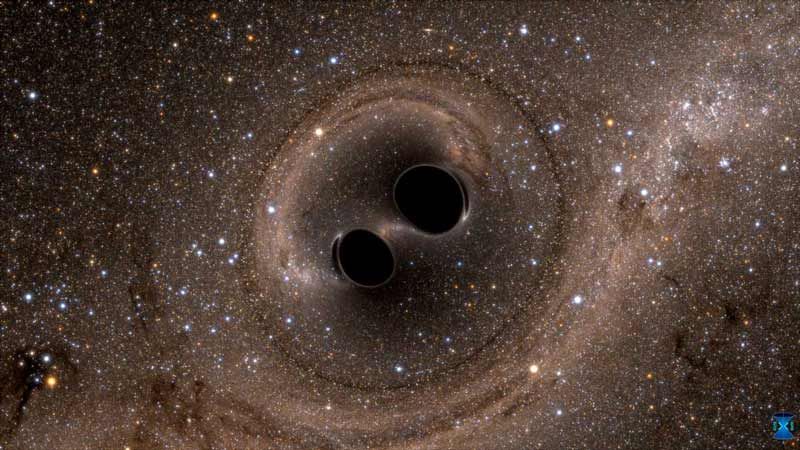
I immediately downloaded the LIGO data onto my laptop, opened MATLAB®, and began analyzing the recorded signals and visualizing the data. In the months that followed, my LIGO colleagues and I confirmed that we had, in fact, detected a gravitational wave, and identified its source: the cataclysmic collision of two black holes with a combined mass 60 times greater than our sun in a galaxy more than one billion light years away (Figure 1).

Figure 1. Computer simulation of the collision of two black holes. Image courtesy SXS, the Simulating eXtreme Spacetimes (SXS) project.
MATLAB is the language used by virtually every team in the world that designs gravitational wave detectors. It is the first tool I go to when I want to design an instrument or look at the data coming out of an instrument. For LIGO, we used it to analyze the fundamental noises that limit gravitational wave detector performance, calculate the optical response of our interferometers, and verify the entire control chain to ensure the validity of the results we observed.
Building the World’s Most Accurate Instrument for Measuring Displacement
During the black hole collision that we observed, over 1030 kilograms of mass was converted into gravitational wave energy, most of it emitted in less than a second. The gravitational wave power radiated by this event was more than 10 times greater than the combined light power of every star and galaxy in the observable universe. To detect it, however, we had to design and build the most sensitive instruments ever created for measuring displacement: two laser interferometers capable of measuring changes in distance on the order of 10-18 meters.
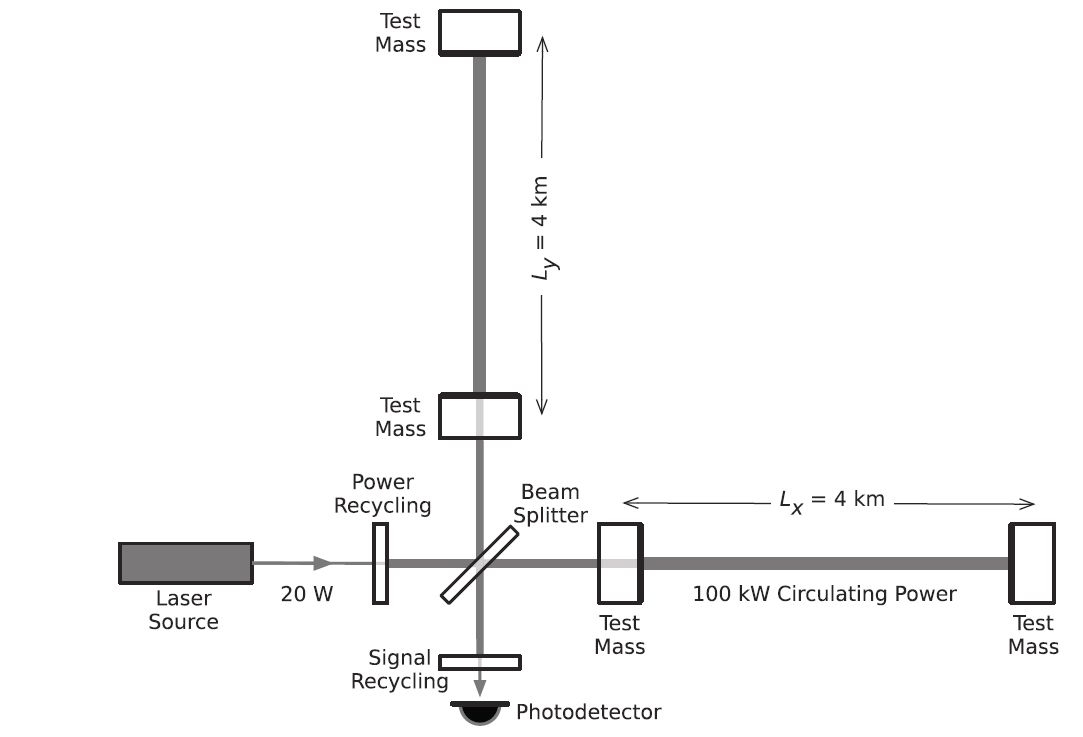
LIGO is the world’s largest gravitational wave observatory. Its two interferometers are located more than 3000 kilometers apart, one in Louisiana and the other in Washington. Interferometers like those in LIGO have two arms oriented at right angles to each other. At the LIGO sites, each arm is 4 km long. We shine a laser beam through a beam splitter, directing the two output beams to the ends of the two arms, where they are reflected back by precisely oriented mirrors (Figure 2). In steady state, the beams, having traveled the same distance through each of the arms, meet back at a terminal photodetector in phase with one another. When a gravitational wave passes through this structure, it distorts the arms of the interferometer, briefly shortening the first and lengthening the second and then reversing this change. The difference in length between the two arms is miniscule—about 1/1000th of the diameter of a proton—but it is enough to affect the time the two beams take to travel through the arms. As a result, they arrive at the photodetector out of phase (at different times from one another), producing an interference pattern that we can measure and observe.

Figure 2. Diagram of a simplified LIGO interferometer. Image courtesy B. P. Abbott et al. (LIGO Scientific Collaboration and Virgo Collaboration), “Observation of Gravitational Waves from a Binary Black Hole Merger,” Phys. Rev. Lett. 116, 061102 – Published 11 February 2016.
Since gravitational waves travel at the speed of light, if one passed by Earth, it would produce similar interference patterns at the Louisiana and Washington detectors within about 10 milliseconds (the time it takes light to travel between the two locations). That is exactly what our systems detected on the morning of September 14.
Noise Analysis and Optical Modeling Tools for Interferometer Design
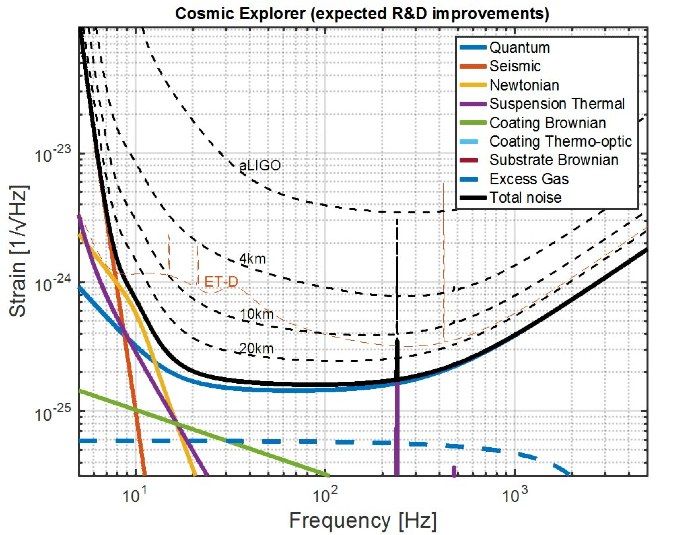
Numerous noise sources on Earth are capable of causing tiny length changes in the arms of LIGO. To investigate the fundamental noises associated with a gravitational wave detector design, we use a Gravitational Wave Interferometer Noise Calculator (GWINC). Developed entirely in MATLAB, this tool is used by physicists around the world to calculate the seismic, thermal, quantum, and other noises that limit gravitational wave detector performance (Figure 3).
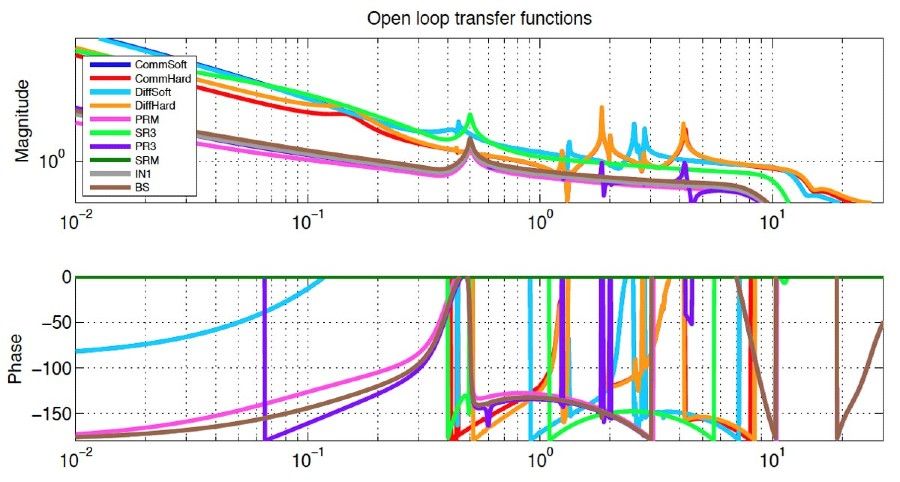
The design and continued enhancement of the LIGO interferometers depended on a thorough understanding of noise effects. It also depended on understanding how the optics that make up the system—including beam splitters, lenses, and mirrors—work together in the complete system. To help researchers with this aspect of the interferometer design, I developed Optickle, a MATLAB based tool for frequency-domain modeling and simulation of interferometers. Optickle generates transfer functions for elements of the optical plant, enabling physicists to calculate and visualize the opto-mechanical frequency response of virtually any interferometer, including those in LIGO (Figure 4).
Updating Filters on the Fly
LIGO has thousands of digital filter modules for noise suppression and signal processing. One advantage of the current LIGO setup over its predecessors is the ability to update these filters on the fly. In the past, we had to power down and then restart the system, a process that took up to an hour. Today, we can change the infinite impulse response (IIR) filter coefficients in the modules in about a minute without shutting the system down.
This capability is made possible by a model of the interferometer real-time control system that we created in MATLAB and Simulink®. For example, to suppress motion of the mirrors below 5 Hz, caused by microseismic peaks from ocean waves hitting the shore, we needed to change the filters to add more gain in the control loop. In MATLAB, we analyzed the feedback loop of the control system and examined the phase margin of that loop. After plotting the necessary transfer functions and determining how much gain we could add, we generated new filter coefficients and loaded them into the filter modules—all while the interferometer was running.
Verifying the First Detection and Anticipating the Next
After the initial detection, I spent days in MATLAB analyzing all the LIGO data from the event to make sure that the signal wasn’t caused by a bug in the system. To do this I reproduced the entire control chain and gravitational wave signal path in MATLAB, including all the filter parameters in use at the time, along with measurements of the detected signal as it moved through the system. This analysis gave us confidence that the signals captured by both interferometers came from a genuine gravitational wave.
About three months after the first event, on Christmas Eve, a second gravitational wave was detected. This one was smaller, the result of a merger of two black holes that were 8 and 14 times greater than the Sun’s mass. The second detection provided further evidence that the first had been no fluke, and it confirmed that we have entered a new era of gravitational wave astronomy.
Gravitational waves give us an entirely new perspective on our universe, enabling us to study events previously invisible to us. I look forward to exploring the data from each new detection in MATLAB and using the tools we’ve developed to further improve gravitational wave detector instrumentation.
Published 2017 - 93128v00

