Analyze Cylindrical Reflector Antenna with Horn Array Feed
This example shows how to analyze an antenna consisting of a cylindrical reflector with a linear array of horns.
Create Horn Antenna
Create a horn antenna resonating at 10 GHz. Set lambda to the free space wavelength at the design frequency of 10 GHz.
freq = 10e9;
lambda = physconst("light")/freq;
h = design(horn,10e9);
h.FlareWidth = 0.0416;
h.FlareLength = 0.0416;
h.FlareHeight = 31.8e-3;
h.Length = 21e-3;
h.FeedOffset(1) = -3.6e-3;
figure
show(h)
Plot VSWR and Radiation Pattern of Horn Antenna
Plot the voltage standing wave ratio (VSWR) of the horn antenna over the frequency range of 8.5–12.5 GHz.
range = (0.85:0.01:1.25)*freq;
figure
vswr(h,range);
ylim([0 5]);

The VSWR of the horn antenna is less than 2 between 8.6–12.2 GHz.
Plot the radiation pattern of the horn antenna.
figure
pattern(h,freq);

The directivity of the antenna is 11.4 dB.
Animate the Field in the E-plane and H-plane
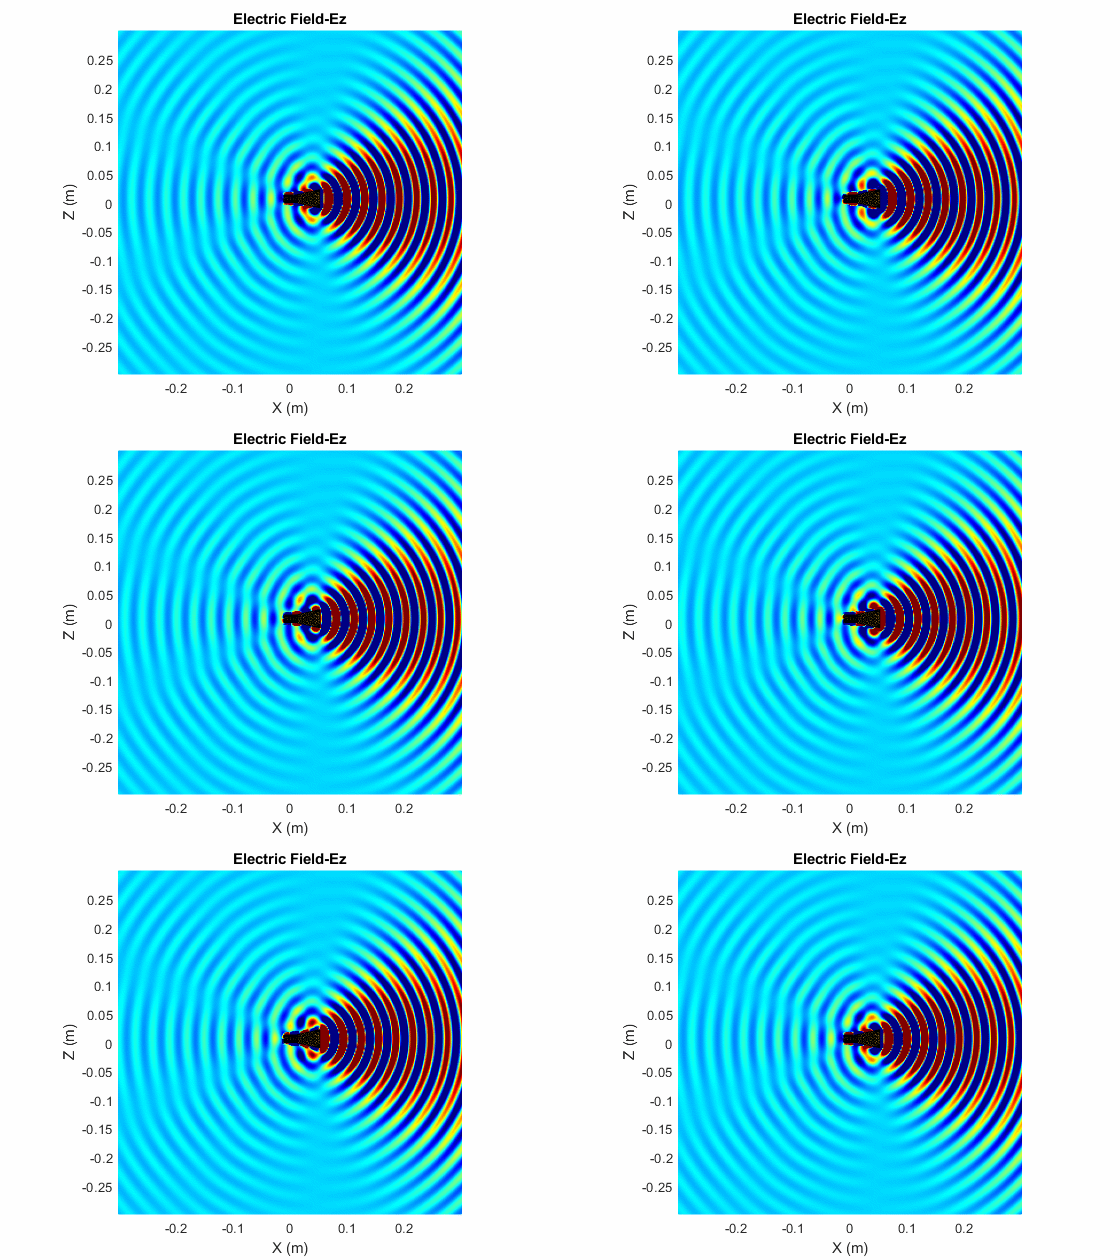
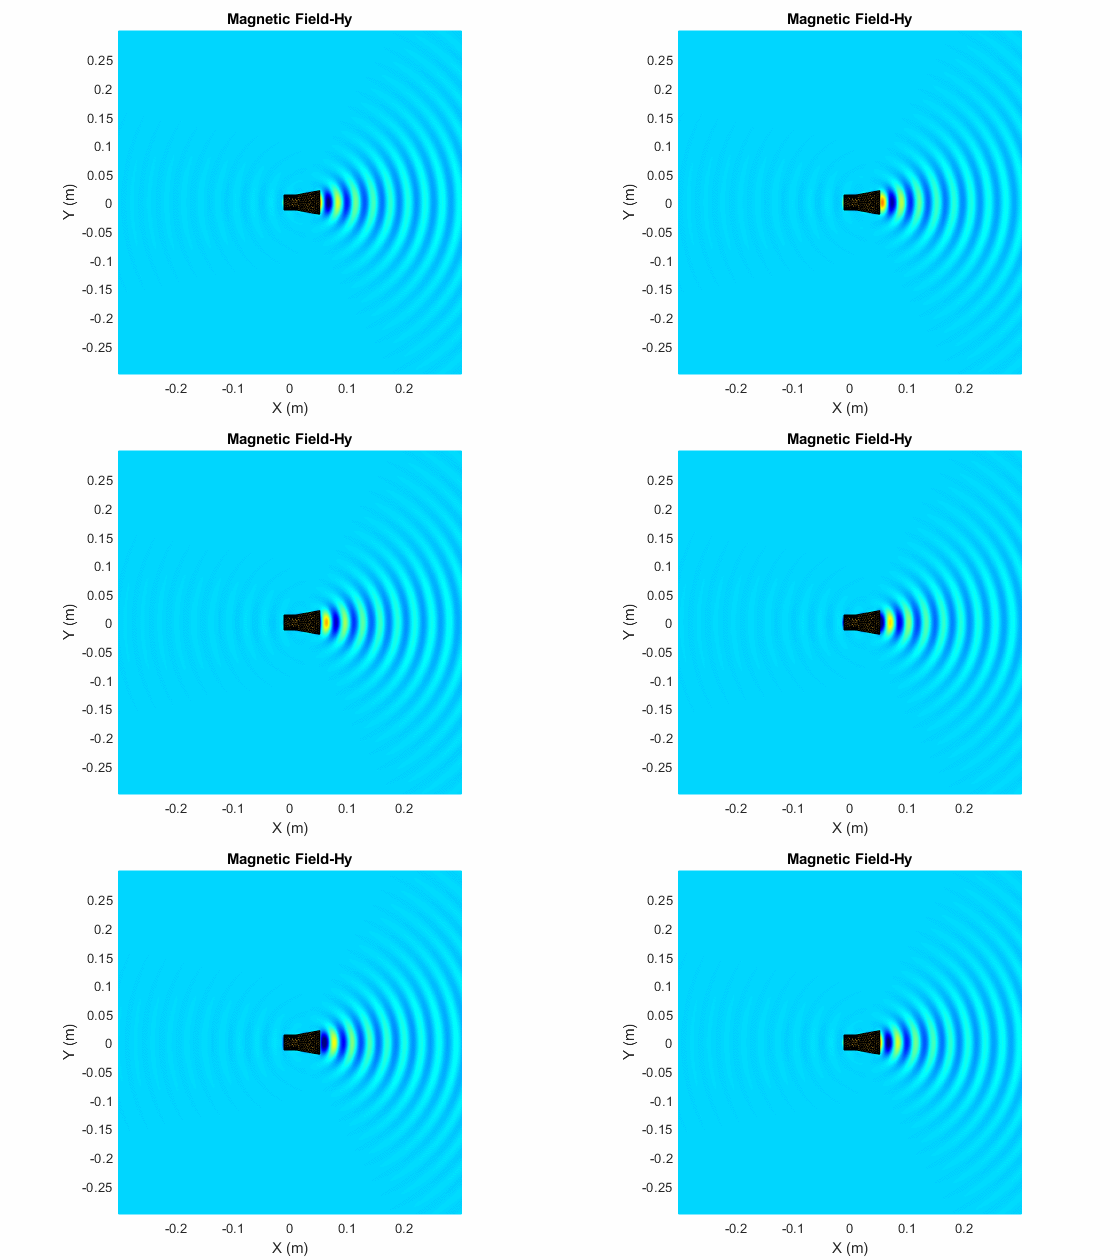
The analysis from the solver provides us with the steady state result. The field calculation provides the 3 components of the electric and magnetic field in phasor form in the cartesian coordinate system. Animate this field by using a propagator defined by the frequency, fc to bring the result back to time-harmonic form and visualize on the E-plane and H-plane. In the case of the horn, E-plane is the XZ plane and H-plane is the XY plane. As noted in the far-field pattern plot shown in the previous section, the main lobe is along the positive x-axis. Use the helperAnimateEHFields function as shown below. Define the spatial extent, point density as well as the total number of time periods defined in terms of the frequency fc. Choose the Ez component with the plotting plane defined as XZ for the E-field and the Hy component with the plotting plane defined as XY for the animation. If the sampling time is not defined, the function automatically chooses a sampling time based on 10 times the center frequency. There is also an option available to save the animation output to a gif file with an appropriate name specified.
% Define Spatial Plane Extent
SpatialInfo.XSpan = 20*lambda;
SpatialInfo.YSpan = 20*lambda;
SpatialInfo.ZSpan = 20*lambda;
SpatialInfo.NumPointsX = 300;
SpatialInfo.NumPointsY = 300;
SpatialInfo.NumPointsZ = 300;
% Define Time Extent
Tperiod = 1/freq;
T = 1*Tperiod;
TimeInfo.TotalTime = T;
TimeInfo.SamplingTime = [];
% Define E-Field Data details
DataInfo.Component = 'Ez';
DataInfo.PlotPlane = 'XZ';
DataInfo.DataLimits = [-5 10];
DataInfo.ScaleFactor = 1;
DataInfo.GifFileName = 'hornEz.gif';
DataInfo.CloseFigure = true;
%% Animate
helperAnimateEHFields(h,freq,SpatialInfo, TimeInfo, DataInfo)

% Define H-Field Data details
DataInfo.Component = 'Hy';
DataInfo.PlotPlane = 'XY';
DataInfo.DataLimits = [-0.25 0.5];
DataInfo.ScaleFactor = 1;
DataInfo.GifFileName = 'hornHy.gif';
%% Animate
helperAnimateEHFields(h,freq,SpatialInfo, TimeInfo, DataInfo)

Create Linear Array of Horns
Create a linear array of horns. Set the number of elements in the array to 4 and the spacing between the elements to 1.5 times of lambda.
arr = linearArray(Element=h,NumElements=4);
arr.Element.Tilt = -90;
arr.Element.TiltAxis = 'Z';
arr.ElementSpacing = 1.5*lambda;
figure
show(arr)
Create Cylindrical Reflector with Horn Array
Create a cylindrical reflector with the linear array of horns as the exciter. Tilt the exciter at an angle of 90 degrees along the Z-axis and 70 degrees along the Y-axis.
ref = reflectorCylindrical;
ref.GroundPlaneLength = 10.2*lambda;
ref.GroundPlaneWidth = 10.3*lambda;
ref.Spacing = 8.5*lambda;
ref.Tilt = 90;
ref.Exciter = arr;
ref.Exciter.Tilt = [90 70];
ref.Exciter.TiltAxis = ['Z','Y'];
figure
show(ref)

Mesh and Plot Radiation Pattern of Cylindrical Reflector with Horn Array
Mesh the reflector manually with the maximum edge length of lambda/10.
figure
mesh(ref,MaxEdgeLength=lambda/10);

Load the solved reflector file refObj.mat.
load("refObj.mat");Plot the radiation pattern.
figure
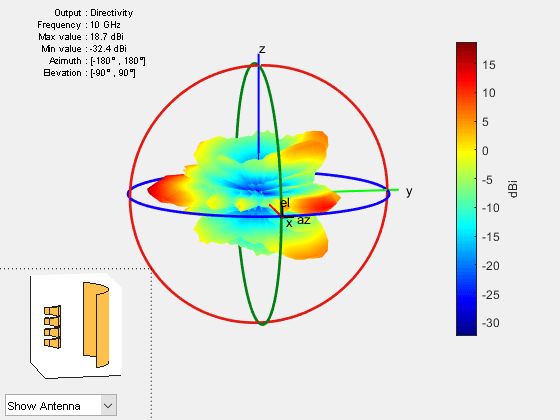
pattern(ref,freq);
view([80 10]);

You can also plot the radiation pattern without using the MAT file, but the pattern(ref,freq) command takes up to 18 minutes to plot the radiation pattern. To run the pattern(ref,freq) command, these machine configurations are preferred:
Processor: Intel ® Xeon ® CPU E5-1650 v4 @3.60GHz.
RAM: 64GB.
System type: 64-bit operating system.
The directivity of the cylindrical reflector antenna with a horn array feed is 18.7 dB.
See Also
Topics
References
[1] Zhang.R, Z. Xie and Q. Chu. "A New Horn Array Feed for Parabolic Cylindrical Reflector Antenna." 2007 Asia-Pacific Microwave Conference, 2007, pp.1-4. doi: 10.1109/APMC.2007.4555169.