Debug Generated Code During SIL or PIL Execution
If a software-in-the-loop (SIL) or processor-in-the-loop (PIL) execution fails or you notice differences between the outputs of your original functions and the generated code, you can rerun the execution with a debugger enabled. By inserting breakpoints, you can observe the behavior of code sections, which might help you to understand the cause of the problem.
For a SIL or PIL execution failure, you can also view information from the standard output and standard error streams in the MATLAB® Command Window. For example:
Output from
printfstatements in your code.If you enable run-time error detection, messages sent to
stderr.Some low-level system messages.
Note
During a SIL execution, the target application redirects the
stdout and stderr streams. When the
application terminates, the MATLAB Command Window displays the information from the redirected streams.
The target application also provides a basic signal handler, which captures the
POSIX® signals SIGFPE, SIGILL,
SIGABRT, and SIGSEV. For this signal
handler, the target application includes the file
signal.h.
SIL Debugging
This table gives information about debugger support.
| Operating System | Supported Debuggers |
|---|---|
Windows® | Microsoft® Visual Studio® IDE. |
Visual Studio Code with MinGW® GDB. Requires installation of MATLAB Coder™ Interface for Visual Studio Code Debugging support package. See https://www.mathworks.com/matlabcentral/fileexchange/103555-matlab-coder-interface-for-visual-studio-code-debugging. | |
Linux® | GNU® Data Display Debugger (DDD). |
Visual Studio Code with GDB. Requires installation of MATLAB Coder Interface for Visual Studio Code Debugging support package. See https://www.mathworks.com/matlabcentral/fileexchange/103555-matlab-coder-interface-for-visual-studio-code-debugging. |
Note
You can perform SIL debugging only if the MATLAB product family supports your Microsoft Visual C++®, Xcode, or GNU GCC compiler. For more information, see supported compilers.
To run a SIL execution with debugging enabled in the MATLAB Coder app:
In the Verify section of MATLAB Coder toolstrip tab, open the Run Generated Code drop-down menu.
In the Verification Settings section, select the Enable source-level debugging for SIL or PIL check box.
Use the Run file option to select a test bench.
On a Windows computer, your user_fn.cuser_fn.cppuser_fn_initialize and
user_fn functions.
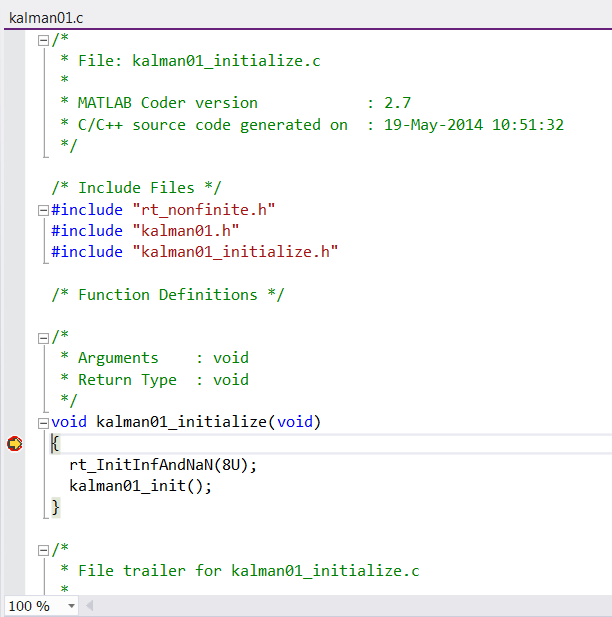
You can now use the debugger features to observe code behavior. For example, you can step through code and examine variables.
When using a dynamic link library (DLL), Microsoft Visual Studio applies two breakpoints per function breakpoint for SIL debugging: one for the C/C++ code function and another for the DLL entry point in disassembly code. When the debugger runs through the code, it reaches the DLL entry point first. To reach the corresponding point in the C/C++ code, click the Continue button (F5).
To end the debugging session:
Remove all breakpoints.
Click the Continue button (F5).
The SIL execution runs to completion.
To terminate the SIL execution process, on the Test Output tab, click the link that follows
To
                                terminate execution
, for example,clear kalman01_sil.The Microsoft Visual Studio IDE closes automatically.
Note
If you select Debug > Stop Debugging, the SIL execution times out with the following error message:
Communications error: failed to send data to the target. There might be
multiple reasons for this failure.

...
...
PIL Debugging
When you set up PIL connectivity between Simulink® and the target hardware, specify a debugger by using
target.ExecutionService and
target.DebugExecutionTool objects — see Support PIL Debugging and DebugExecutionTool Template.
To run a PIL execution with debugging enabled in the MATLAB Coder app:
In the Verify section of MATLAB Coder toolstrip tab, open the Run Using PIL drop-down menu.
In the Verification Settings section, select the Enable source-level debugging for SIL or PIL check box.
Use the Run file option to select a test bench.