Interactive Image Viewing and Processing Tools
The toolbox includes several tools that you can use to interact with an image displayed in a MATLAB® figure window. For example, you can use tools to adjust the display of the image, get information about the image data, and adjust the contrast or crop the image.
You can use the tools independently or in combination. You can create custom image processing apps that open a combination of tools and initialize their display and interactions. For more information, see Interactive Tool Workflow.
You can also access all tools using Image Tool (imtool).
| Tool | Example | Description |
|---|---|---|
Adjust Contrast tool | 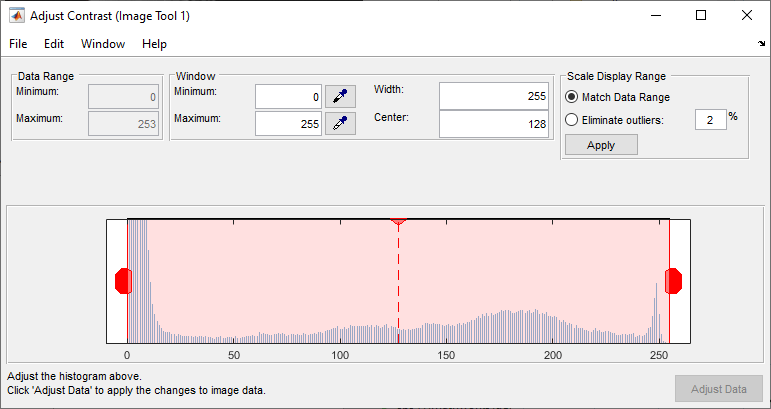 | Displays a histogram of the target image and enables interactive adjustment of contrast and brightness by manipulation of the display range. Use the |
Choose Colormap tool | 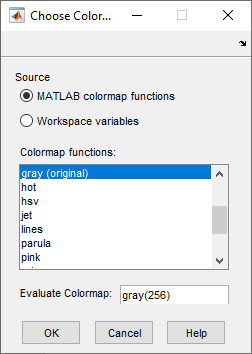 | Allows you to change the colormap of the target figure. You can select one of the MATLAB colormaps, select a colormap variable from the MATLAB workspace, or enter a custom MATLAB function. Use the |
Crop Image tool | 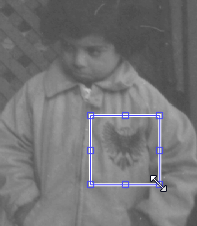 | Displays a draggable, resizable rectangle on an image. You can move and resize the rectangle to define the crop region. Double-click to perform the crop operation or select Crop Image from the context menu. Use the |
Display Range tool | 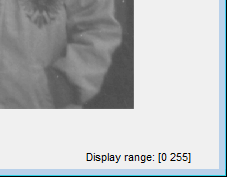 | Displays the display range values of the associated image. Use the |
Distance tool | 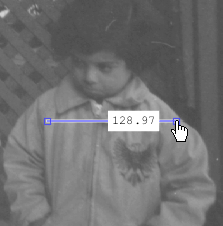 | Displays a draggable, resizable line on an image. Superimposed
on the line is the distance between the two endpoints of the line.
The distance is measured in units specified by the
Use the
|
Image Information tool |  | Displays basic attributes about the target image. If the image displayed was specified as a graphics file, the tool displays any metadata that the image file might contain. Use the
|
Magnification box | 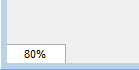 | Creates a text edit box containing the current magnification of the target image. Users can change the magnification of the image by entering a new magnification value. Use Note The target image must be contained in a scroll panel. |
Overview tool | 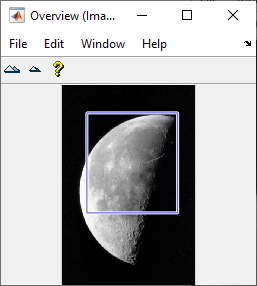 | Displays the target image in its entirety with the portion currently visible in the scroll panel outlined by a rectangle superimposed on the image. Moving the rectangle changes the portion of the target image that is currently visible in the scroll panel. Use Use Note The target image must be contained in a scroll panel. |
Pixel Information tool | Displays information about the pixel the mouse is over in the target image. Use If you want to display only the pixel
values, without the Pixel info
label, use | |
Pixel Region tool | Display pixel values for a specified region in the target image. Use Use | |
Save Image tool |  | Display the Save Image dialog window. In the window, navigate to the desired directory, specify the name of the output image, and choose the file format used to store the image. Use
|
Scroll Panel tool |  | Display target image in a scrollable panel. Use
|