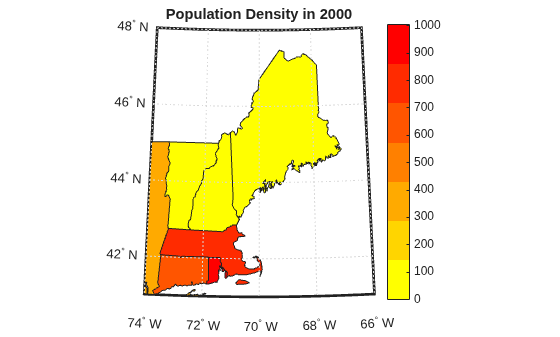
Create Choropleth Map of Population Density
R2026bCreate a choropleth map of population density for several US states in the year 2000. A choropleth map indicates the values of numeric attributes within spatial regions by using colors along a gradient.
This page shows how to create similar maps using map axes (since R2023a) and axesm-based maps. For a comparison of map axes and axesm-based maps, including when to use each type of display, see Choose a 2-D Map Display.
Prepare Data
Prepare the data to use in the examples.
Import a shapefile containing population density data for each US state. The shapefile represents the states using polygon shapes in geographic coordinates.
states = readgeotable("usastatelo.shp");Create a subtable that includes New York and the states that comprise New England: Maine, New Hampshire, Vermont, Massachusetts, Connecticut, and Rhode Island.
names = ["New York","Maine","New Hampshire","Vermont","Massachusetts", ...
    "Connecticut","Rhode Island"];
NEstates = geocode(names,states);
Create Map Using Map Axes
Create a choropleth map using a map axes object.
Set up a map using a projection that is appropriate for an area of interest (AOI) in the northeast United States. Apply a cartographic map layout. Then, display the state polygons on the map. Specify the colors using the population data in the table.
figure
aoi = aoiquad([41 48],[-74 -66]);
newmap(aoi)
hold on

mx = gca;
mx.MapLayout = "cartographic";

geoplot(NEstates,ColorVariable="PopDens2000")
Create a colormap with colors that transition from yellow to red. Apply the colormap to the map axes. Then, add a color bar and a title.
cmap = flipud(autumn(height(NEstates)));
colormap(cmap)

colorbar
title("Population Density in 2000")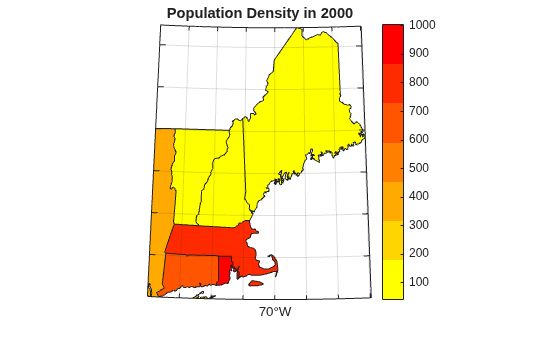
Create Map Using axesm-Based Map
Create a choropleth map using an axesm-based map object.
Set up an axesm-based map using a projection that is appropriate for a region in the northeast United States.
figure
usamap([41 48],[-74 -66])
Assign colors to the polygons based on the population density by creating a symbol specification. Specify the colors using a colormap that transitions from yellow to red.
maxdensity = max([NEstates.PopDens2000]);
cmap = flipud(autumn(height(NEstates)));
polyColors = makesymbolspec("Polygon", ...
    {"PopDens2000",[0 maxdensity],"FaceColor",cmap});
Display the state polygons on the map. Specify the colors using the symbol specification.
geoshow(NEstates,SymbolSpec=polyColors)
Apply the colormap to the axes. Then, add a color bar and a title.
colormap(cmap)

colorbar
clim([0 maxdensity])
title("Population Density in 2000")