Animation Techniques
You can use several techniques to create animations in MATLAB®.
| Technique | Description | Example |
|---|---|---|
Update data in a loop. | Update the properties of a graphics object and display the updates on the screen in a loop. This technique is useful for creating animations when most of the plot remains the same. | |
Apply matrix transformations. | Group graphics objects together and apply transformations to the group as a whole. This technique is useful when you want change the position and orientation of a group of objects together. | |
Create an animated GIF file. | Update a figure and capture the frames of an animated GIF
file using the This technique is useful for creating animations that you want to store and replay. | |
Create a movie. | Update a figure and capture the frames of a movie using the
This technique is useful for
complex animations that do not draw quickly in real time or when
you want to store and replay an animation. Use the | |
Create an animated line. | Create line animations of data using the This technique is useful for optimizing line animations. | |
Use specialized animation functions. | For more specialized animations, you can use functions such
as |
Create Animation by Updating Data in Loop
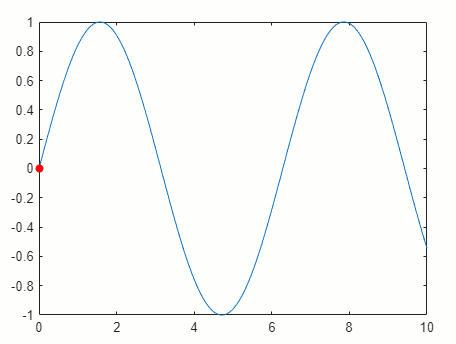
Create an animation of a marker moving along a line.
Plot a sine wave. Then create a marker and save it as the variable
mkrso you can access its properties later.Use the
xlim,ylim, andzlimfunctions to set the limits of each axis. Setting the limits disables the automatic axis limits calculation, which can cause the animation to flicker and slow down.Create a
for-loop that updates the coordinates of the marker. Change theXDataandYDataproperties of theScatterobject (mkr) at each iteration to move the marker along the line.Call the
drawnowfunction at the end of each loop iteration to update the figure display.
x = linspace(0,10,500);
y = sin(x);

% Plot a line and create a marker
plot(x,y)
hold on
mkr = scatter(NaN,NaN,[],"red","filled");
hold off
xlim([0 10])
ylim([-1 1])
zlim([-1 1])

% Move the marker along the line
for i = 1:length(x)
    mkr.XData = x(i);
    mkr.YData = y(i);
    drawnow
end
Create Animation Using Matrix Transformation
An efficient way to animate a plot is to apply a transformation matrix to one or more objects rather than iterating over all the points. In this technique, you group one or more graphics objects as children under a Transform object and then set the Matrix property of the Transform object to adjust the position of all its children. The transformations you can use include translation, rotation, and scaling. You can also define your own transformation matrix.
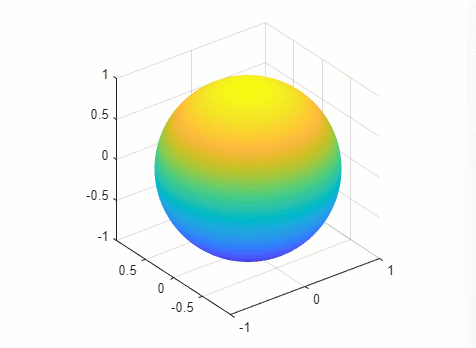
Create an animation of a rotating sphere.
Create the coordinates of a sphere using the
spherefunction.Create a
Transformobject namedgrpby using thehgtransformfunction. Then plot the sphere as aSurfaceobject by calling thesurffunction and specifying the parent object asgrp.Display the axes grid lines and show the plot box in a 3-D view.
Create a
for-loop that steps through 300 equally spaced angle values from 0 to 2π, rotating the sphere by a small angle at every iteration. Use themakehgtformfunction to create the transformation matrix for each small angle of rotation. Then set theMatrixproperty ofgrpto perform the rotation.Call the
drawnowfunction at the end of each loop iteration to update the figure display.
% Create the coordinates of a sphere
ax = axes;
[x,y,z] = sphere(270);

% Create transform object and plot the sphere
grp = hgtransform(Parent=ax);
s = surf(ax,x,y,z,z,Parent=grp,EdgeColor="none");

% Display grid lines and show the plot box in 3-D
grid on
view(3)
axis vis3d
axis tight manual

% Rotate the sphere by small angles in a loop
for ang = linspace(0,2*pi,300)
   tm = makehgtform("axisrotate",[1,1,1],ang);
   grp.Matrix = tm;
   drawnow
end
Create Animated GIF File
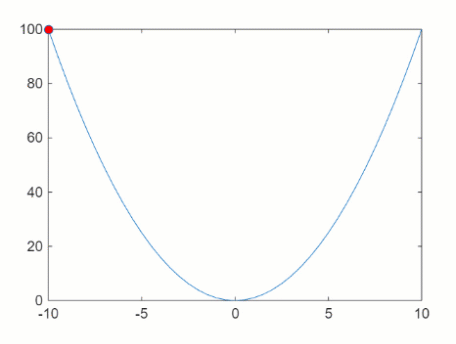
Create an animated GIF file of a marker moving along a parabola.
Plot a parabola with one marker.
Create a
for-loop that changes the location of the marker at every iteration.At the end of each loop iteration, capture the figure as a frame of an animated GIF file using the
exportgraphicsfunction. For the first loop iteration, set theAppendname-value argument tofalseto create a new file with the first frame. Then, for the remaining loop iterations, set theAppendname-value argument totrueto capture the current frame and append it to the specified GIF file.The resulting
parabola.giffile is saved to your current folder.
% Plot a parabola and a marker
x = -10:0.5:10;
y = x.^2;
p = plot(x,y,"-o",MarkerFaceColor="red");

% Move the marker along the parabola and capture frames in a loop
for i = 1:41
    p.MarkerIndices = i;
    if i == 1
        exportgraphics(gca,"parabola.gif",Append=false)
    else
        exportgraphics(gca,"parabola.gif",Append=true)
    end
end
Create and Play Movie
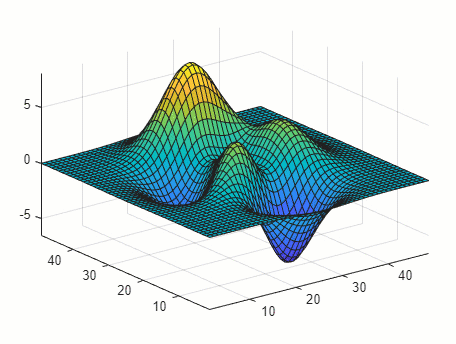
Create a movie of a surface plot changing shape by using the getframe function in a loop. The
getframe function captures the movie frames in an array of
structures, and you use the movie function to play the movie.
Plot the coordinates of the
peaksfunction as a surface using thesurffunction, and save theSurfaceobject as the variables.Position the plot box tightly around the surface and freeze the axes limits using the
axis tight manualcommand.Create an array of 40 structures named
Fto contain the animation frames.Create a
for-loop that changes the shape of the surface at every iteration.At the end of each loop iteration, update the figure using the
drawnowcommand and capture a movie frame using thegetframefunction.The resulting movie is saved as the structure array
F.
% Plot a surface
Z = peaks;
s = surf(Z);
axis tight manual

% Change the shape of the surface and capture frames
loops = 40;
F(loops) = struct("cdata",[],"colormap",[]);
for j = 1:loops
    Zframe = sin(j*pi/10)*Z;
    s.ZData = Zframe;
    drawnow
    F(j) = getframe(gcf);
end
Play the movie two times.
fig = figure;
movie(fig,F,2)
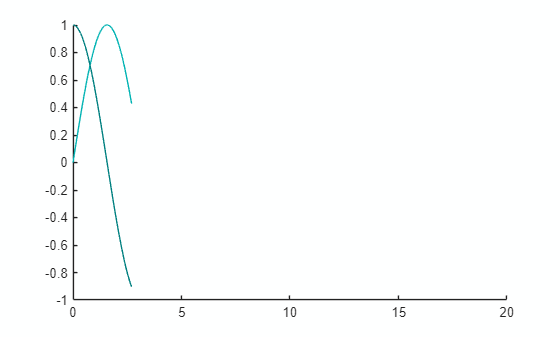
Create Animated Line
The animatedline function helps you to optimize line
animations. It allows you to add new points to a line without redefining existing
points.
Create an animation of two growing lines.
Create two animated lines of different colors.
Set the axis limits before the loop to avoid recalculating the limits in each loop iteration.
Create a
for-loop that adds points to the lines.Use
drawnowordrawnow limitrateat the end of each loop iteration to update the figure display.
% Create two animated lines of different colors
a1 = animatedline(Color=[0 0.7 0.7]);
a2 = animatedline(Color=[0 0.5 0.5]);
axis([0 20 -1 1])
drawnow

x = linspace(0,20,10000);
for k = 1:length(x)
    % Add to first line
    xk = x(k);
    ysin = sin(xk);
    addpoints(a1,xk,ysin);

    % Add to second line
    ycos = cos(xk);
    addpoints(a2,xk,ycos);

    % Update screen
    drawnow limitrate
end
See Also
Functions
hgtransform|makehgtform|exportgraphics|getframe|movie|writeVideo