Add Grid Lines and Edit Placement
This example shows how to add grid lines to a graph. It also describes how to edit the placement of the grid lines and modify their appearance.
Display Grid Lines
Create a bar chart and display grid lines. The grid lines appear at the tick marks.
y = rand(10,1);
bar(y)
grid on
Add minor grid lines between the tick marks.
grid minor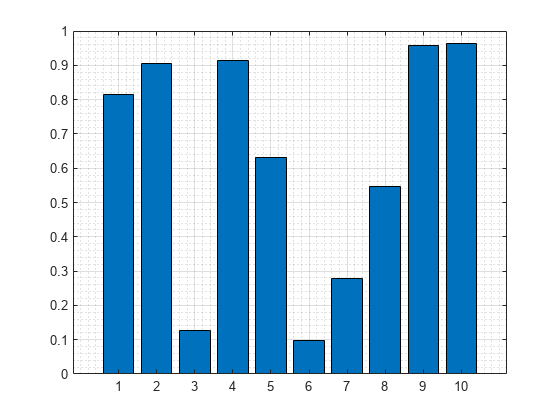
Turn off all the grid lines.
grid off
Display Grid Lines in Specific Direction
Display the grid lines in a particular direction by accessing the Axes object and setting the XGrid, YGrid, and ZGrid properties. Set these properties to either 'on' or 'off'.
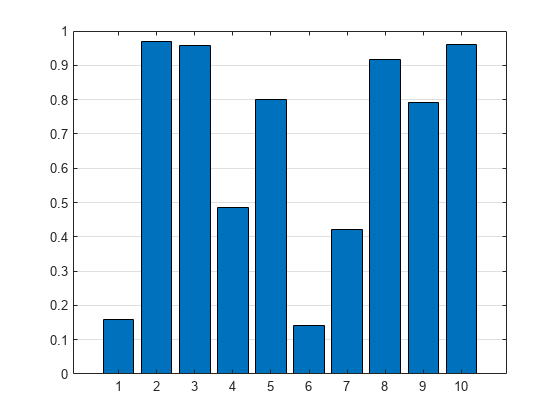
Create a 2-D plot and display the grid lines only in the y direction.
y = rand(10,1);
bar(y)
ax = gca;
ax.XGrid = 'off';
ax.YGrid = 'on';
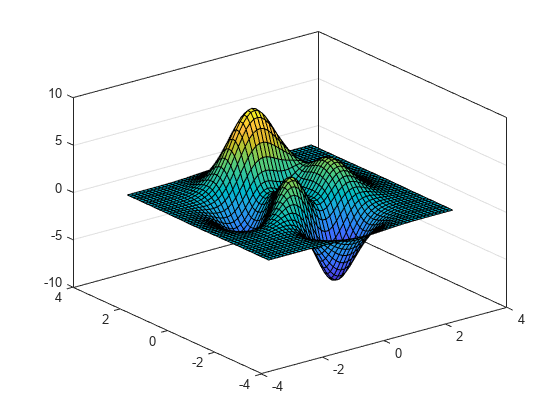
Create a 3-D plot and display the grid lines only in the z direction. Use the box on command to show the box outline around the axes.
[X,Y,Z] = peaks;
surf(X,Y,Z)
box on
ax = gca;
ax.ZGrid = 'on';
ax.XGrid = 'off';
ax.YGrid = 'off';
Edit Grid Line Placement
Create a scatter plot of random data and display the grid lines.
x = rand(50,1);
y = rand(50,1);
scatter(x,y)
grid on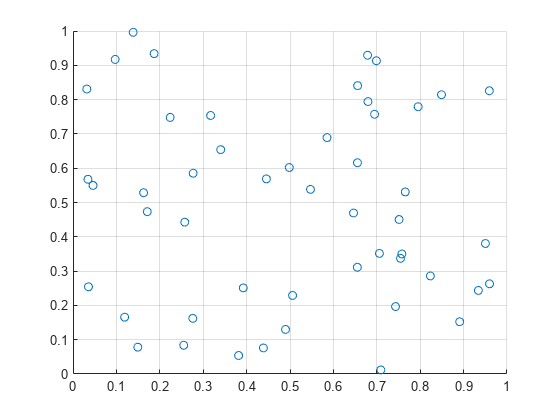
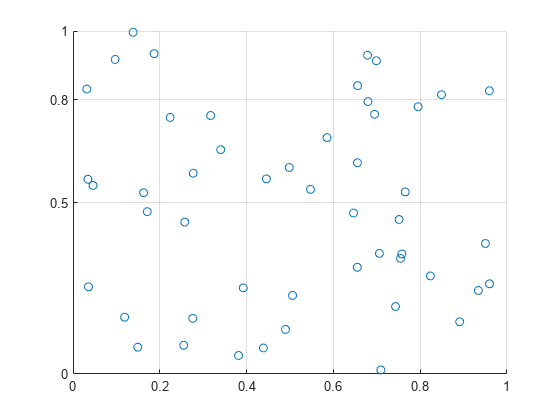
Grid lines appear at the tick mark locations. Edit the placement of the grid lines by changing the tick mark locations.
xticks(0:0.2:1)
yticks([0 0.5 0.8 1])
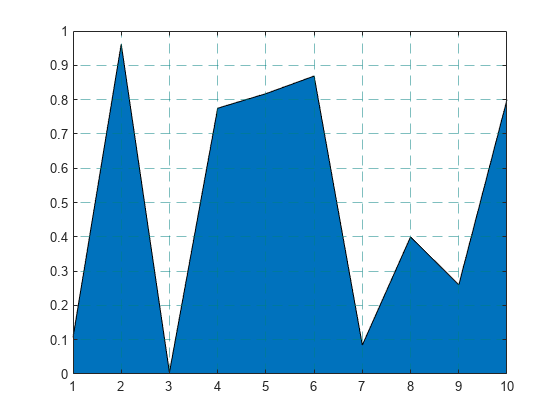
Modify Visual Appearance of Grid Lines
Change the color, line style, and transparency of grid lines for an area plot. Modify the appearance of the grid lines by accessing the Axes object. Then set properties related to the grid, such as the GridColor, GridLineStyle, and GridAlpha properties. Display the grid lines on top of the plot by setting the Layer property.
y = rand(10,1);
area(y)
grid on

ax = gca;
ax.GridColor = [0 .5 .5];
ax.GridLineStyle = '--';
ax.GridAlpha = 0.5;
ax.Layer = 'top';