Polynomial Curve Fitting
This example shows how to fit a polynomial curve to a set of data points using the polyfit function. You can use polyfit to find the coefficients of a polynomial that fits a set of data in a least-squares sense using the syntax
p = polyfit(x,y,n),
where:
xandyare vectors containing thexandycoordinates of the data pointsnis the degree of the polynomial to fit
Create some x-y test data for five data points.
x = [1 2 3 4 5];
y = [5.5 43.1 128 290.7 498.4];
Use polyfit to find a third-degree polynomial that approximately fits the data.
p = polyfit(x,y,3)
p = 1×4

   -0.1917   31.5821  -60.3262   35.3400
After you obtain the polynomial for the fit line using polyfit, you can use polyval to evaluate the polynomial at other points that might not have been included in the original data.
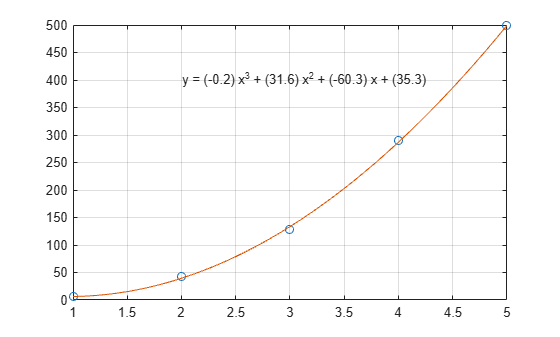
Compute the values of the polyfit estimate over a finer domain and plot the estimate over the real data values for comparison. Include an annotation of the equation for the fit line.
x2 = 1:.1:5;
y2 = polyval(p,x2);
plot(x,y,'o',x2,y2)
grid on
s = sprintf('y = (%.1f) x^3 + (%.1f) x^2 + (%.1f) x + (%.1f)',p(1),p(2),p(3),p(4));
text(2,400,s)