Run Polyspace as You Code in Visual Studio and Review Results
You can choose to run Polyspace® as You Code automatically every time you save your code in Visual Studio®, or manually. The analysis runs on the file that is currently active in the IDE. (The file must be part of a Visual Studio project, which can be part of a Visual Studio solution.) After analysis, you see bugs and coding standard violations as source code markers or in a separate list.
Confirm Installation of Extension
To confirm that your Visual Studio installation has the Polyspace as You Code extension, check the list of installed extensions. Select Extensions > Manage Extensions and confirm Polyspace as You Code appears in the Installed pane.
You can also confirm that the extension starts as expected in the
Output view. In the Output view, select
Polyspace as You Code from the Show output
from list. If the extension starts without errors, you see a message
similar to this one:
[Information] No setting set for the port. Trying to find a free port.
[Information] Connector was successfully started on port 51294
The Polyspace Connector is an internal server that handles communication between the Polyspace as You Code analysis engine and the Visual Studio extension. If the default port is not available, the extension increments the port number by 1 and attempts to start the Polyspace Connector on this port. If you use multiple Visual Studio instances, you can run Polyspace as You Code on all the instances. The Polyspace Connector uses a different port for each instance.
Open Polyspace as You Code Perspective
The Polyspace as You Code extension has a dedicated perspective in Visual Studio that groups all the relevant Polyspace views.
To open the Polyspace as You Code perspective, select Extensions > Polyspace > Open Polyspace Windows
The different views in the Polyspace as You Code perspective show information about
the state of your configuration and about the files that you select for analysis. For
more information, click ![]() in the Configuration or
Quality Monitoring view to open the documentation.
in the Configuration or
Quality Monitoring view to open the documentation.
Quality Monitoring View
The Quality Monitoring view shows all the files that you have selected for analysis, along with the status of the analysis and number of findings for each file.
To analyze a file, select the file and click ![]() . You can also start a sequential file-by-file
analysis by clicking
. You can also start a sequential file-by-file
analysis by clicking ![]() .
.
Click ![]() to configure adding files to the
Quality Monitoring view when you save the file. See Configure Polyspace as You Code Extension in Visual Studio. To
add a file manually, right-click the file in the editor or in the Solution
Explorer.
to configure adding files to the
Quality Monitoring view when you save the file. See Configure Polyspace as You Code Extension in Visual Studio. To
add a file manually, right-click the file in the editor or in the Solution
Explorer.
Headers View
When you analyze a file, Polyspace also analyzes the header files that are included by the file and that
are in the same folder as the file. If Polyspace reports findings in a header file, you see an H
next to the analyzed file in the Quality Monitoring view. Click
the analyzed file in that view to list the headers file in the
Headers view.
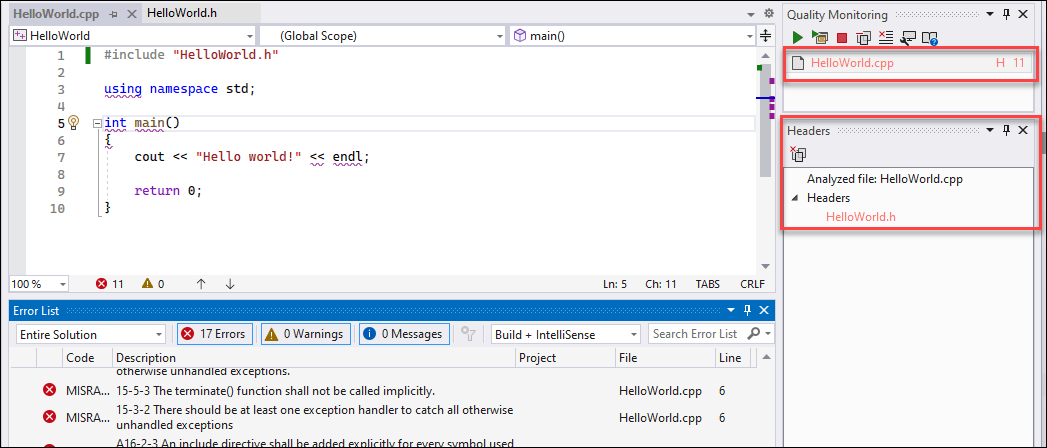
You see header files in the list only if they contain findings. Click the file in the Headers view to open its findings in the Error List view.
Result Details View
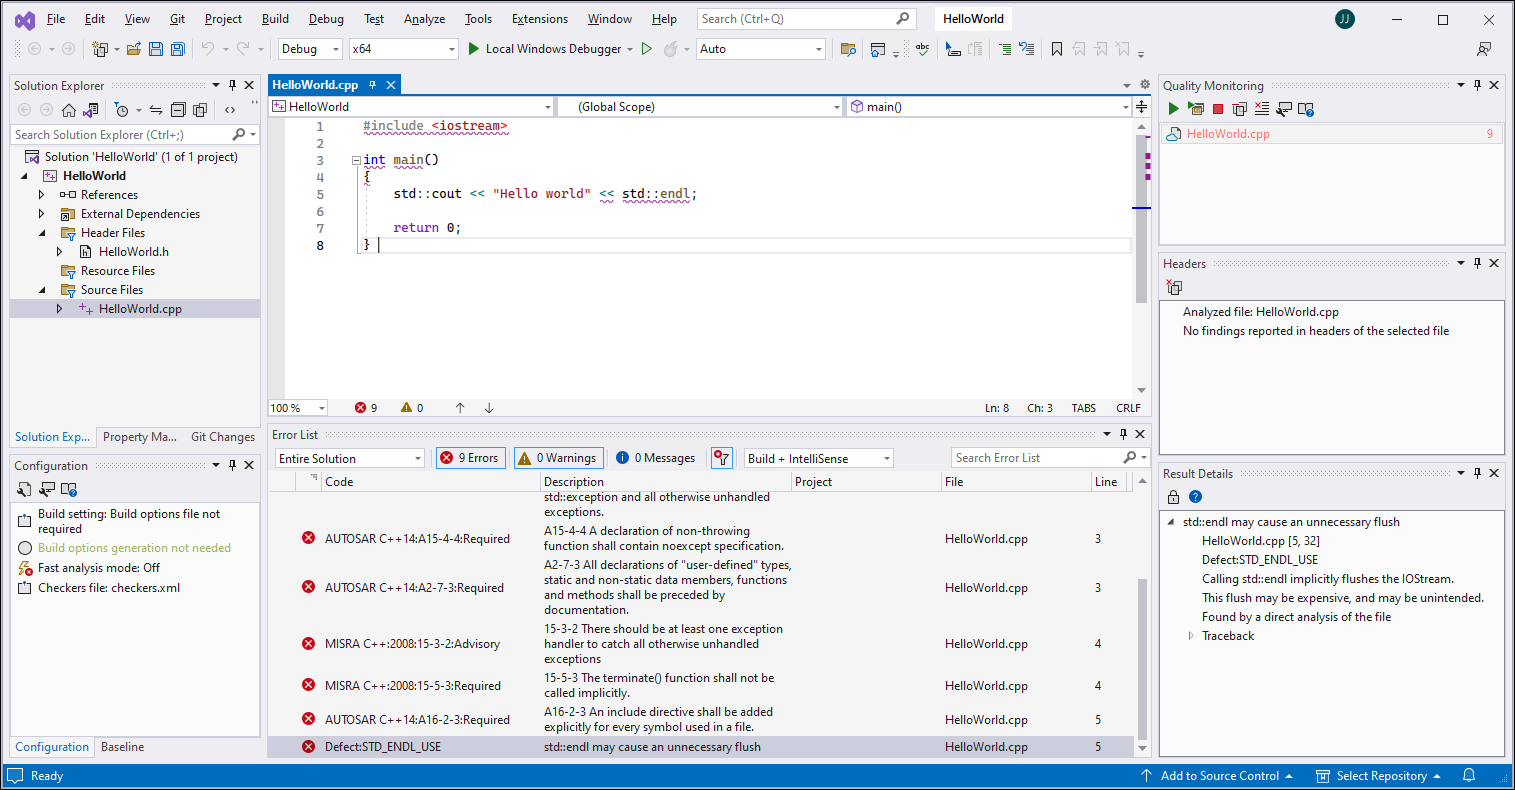
When you select a finding in the Error List view or in the editor, the Result Details view shows additional information about the finding, including (when available) the traceback and the review information imported from the baseline.
If you select multiple lines of code, the Result Details view
shows the result details for all the findings in the selection. Click ![]() to view contextual help about the selected
finding.
to view contextual help about the selected
finding.
To lock this view while you browse findings in the source code or the
Error List view, click ![]() . The Result Details view
does not update when you select a different finding. Click
. The Result Details view
does not update when you select a different finding. Click ![]() again to unlock the Result
Details view.
again to unlock the Result
Details view.
Error List View
The Error List view shows the all the analysis findings, listed one finding per line. Each line shows additional information, such as:
The name of the defect or coding rule, family, and description
Name of the file containing the finding
Review information
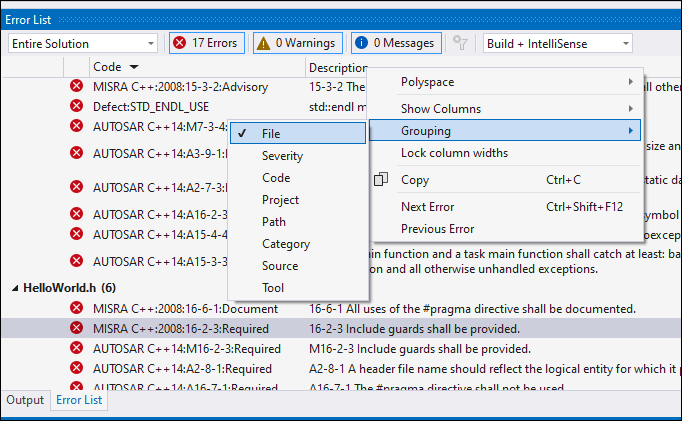
The findings are grouped by results family. To change the grouping or to view findings in a flat list, right-click in the Error List view and select Grouping. Select a column header to sort by.
The results that show in the Error List view represent the results for the files that you select in the Quality Monitoring view. The number of results in the Error List view can change and does not represent results for all analyzed files.
When you select a file in the Quality Monitoring view, in the Error List view you see results from:
Each file listed in the Quality Monitoring view including the selected file.
The header files of the file you select in the Quality Monitoring view.
If you select a different file in the Quality Monitoring view:
Polyspace removes the previously selected file's header file results from the Error List view.
The newly selected file's header file results show in the Error List view.
Configuration View
The Configuration view shows your current Analysis Options settings and the status of the generated build options file, if applicable.
In this view, you can:
Click
 to generate a build options file.
This button is available only if you configure the extension to extract
build options from your build command, from your Visual Studio project, or from a JSON compilation database. See Generate Build Options for Polyspace as You Code Analysis in Visual Studio.
to generate a build options file.
This button is available only if you configure the extension to extract
build options from your build command, from your Visual Studio project, or from a JSON compilation database. See Generate Build Options for Polyspace as You Code Analysis in Visual Studio.Click
 to open the Checkers selection
window. See Configure Checkers for Polyspace as You Code in Visual Studio.
to open the Checkers selection
window. See Configure Checkers for Polyspace as You Code in Visual Studio.Click
 to configure analysis options. See
Configure Analysis Settings.
to configure analysis options. See
Configure Analysis Settings.Click
 to open the Polyspace documentation.
Click the fast analysis mode line to toggle on or off fast analysis mode.
Baseline View
View the current filter settings, any available local baselines, and the status of the download for the Polyspace Access™ baseline. If you have configured the baseline settings, you see information about the Polyspace Access server and the project you use as a baseline. See Set Baseline Polyspace as You Code Results in Visual Studio.

In this view, you can:
Click the filter button to enable or disable filtering for only results that are new compared to a baseline.
Create local baselines for all files in the quality monitoring list. Right-click local baselines and select Create a local baseline for all files in the Quality Monitoring list.
Update or remove a local baseline. Right-click the local baseline and select the relevant option from the menu.
Click
 to download or update a Polyspace
Access baseline.
to download or update a Polyspace
Access baseline.Click
 to open the baseline project in the
Polyspace
Access interface.
to open the baseline project in the
Polyspace
Access interface.Click
to open the Polyspace
Access baseline settings.
If the results from the baseline run are generated with a Polyspace version that is older than your Polyspace as You Code version, the Baseline view shows a warning.
Run Analysis
You can run a Polyspace as You Code analysis in two ways: when you save a file that is in the Quality Monitoring view, or manually.
Run Analysis On Save
By default, the Polyspace as You Code extension adds the current file to the Quality Monitoring view when you save the file, but does not start the analysis.
To enable the analysis of the current file when you save the file, click ![]() in the Quality Monitoring
view and in the Options dialog box, select Start analysis on
save.
in the Quality Monitoring
view and in the Options dialog box, select Start analysis on
save.
After analysis, source code lines that contain findings appear with red underlines. You also see the finding locations as red marks on the scroll bar. Double-click a finding in the Error List view to navigate to the corresponding source code. If the analysis fails, check the messages in the Output view to diagnose the cause of the failure.
If results do not appear, see Troubleshoot Failed Analysis or Unexpected Results in Polyspace as You Code.
Run Analysis Manually
To disable starting an analysis when you save a file, select Tools > Options to open the Options dialog box, select the Polyspace as You Code > Analysis Options node, and then clear the Start analysis on save checkbox. To start an analysis manually, do one of the following:
Click
 in the Quality
Monitoring view to run an analysis on the selected
file.
in the Quality
Monitoring view to run an analysis on the selected
file.Click
 in the Quality
Monitoring view to run analysis sequentially on each file
in the Quality Monitoring list.
in the Quality
Monitoring view to run analysis sequentially on each file
in the Quality Monitoring list. Right-click the file in the editor and select Polyspace > Run Polyspace Analysis to run an analysis on the file open in the editor.
Review Results
After analysis, the results appear in two forms:
As red underlines in the source code.
As a list in the Error List view.
If you select a finding in the Error List view, you see additional details about the finding in the Result Details view. Click
 to open the contextual help for the
currently selected finding.
to open the contextual help for the
currently selected finding.
Apply Suggested Fix for Common Defects or Coding Rule Violations
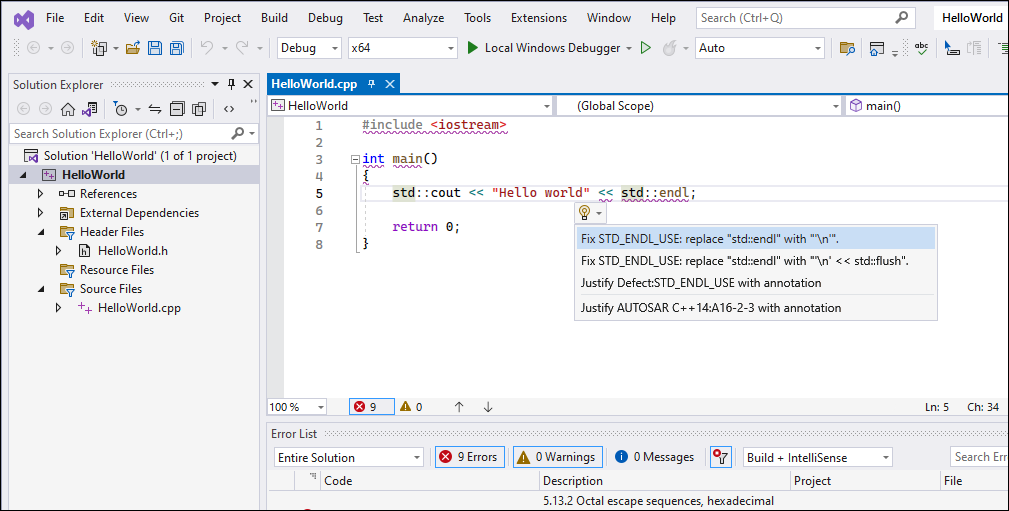
If Polyspace reports certain common defects or coding rule violations in your code, the Polyspace as You Code extension proposes one or more fixes that you can apply to these findings.
To apply a quick fix, select a finding in the editor or the Error
List panel, and then, from the light bulb menu, click the appropriate
option. The quick fix options have the format Fix
checkerName:
proposedFix. Here,
checkerName is the name of the selected defect
checker or coding rule, and proposedFix is the fix that
Polyspace applies to your code. Polyspace edits your code and fixes the issue or all instances of the issue in
the currently active file, depending on the option that you select. If there is more
than one proposed fix, you see all available fixes in the menu.
This table lists the common defects and coding rule violations for which Polyspace proposes a fix, along with the Polyspace checkers that report these issues.
| Common Defect or Coding Rule Violation | Polyspace Checkers That Report the Issue |
|---|---|
Function that could be evaluated a compile time missing
constexpr specifier |
|
Inefficient use of std::any_cast to cast
object by value |
|
Inefficient use of std::string
operator+() |
|
Inefficient use of the [] operator to
insert or assign a value to a key in a
std::map or
std::unordered_map (C++ 17 and later
only) |
|
| Parameter passed by value results in expensive copy |
|
| Unmodified expensive-to-copy parameter passed by value |
|
Unmodified local variable is created by expensive copy from a
const reference |
|
Unmodified variable not declared
const |
|
Unnecessary call to std::move in a return
statement |
|
| Unused include |
|
| Unused parameter |
|
Use of std::endl |
|
Justify Results Using Code Annotations
If you decide not to fix a result, you can justify the result by adding code annotations. If the annotations follow a specific syntax, subsequent Polyspace as You Code runs can read these annotations and suppress the corresponding result.
To add a code annotation, right-click a finding in the Error List view and select Polyspace > Justify the current result. The annotation is entered on the same line as the finding. You can also apply an annotation by pointing to the code marker for that result.
To justify all findings of the same defect or coding rule violation in the current file, right-click a finding in the Error List view and select Polyspace > Justify all instances of the selected finding. Polyspace inserts an annotation in your code on each line that contains this finding.
If you import review information from a baseline run, any status, severity, or comment from the baseline run is automatically applied to the corresponding Polyspace as You Code finding.
Findings with an imported status of
Not a defect,Justified, orNo action plannedare removed from the Error List view and those findings are suppressed in subsequent analyses.
Polyspace as You Code inserts code annotations as comments enclosed in
/* */ or C files and prefixed with // in
C++ files. The comment format in C files complies with MISRA C:2004 Rule 2.2. See
MISRA C:2004 and MISRA AC AGC Rules (Polyspace Bug Finder).
See also:
View Context-Sensitive Help for Result
You can see more information on a type of result by visiting the context-sensitive help page for the result.
To open the context-sensitive help for a finding, select that finding in your code or
in the Error List, and then click ![]() in the Result Details
view.
in the Result Details
view.
You can also open the full searchable documentation for the Polyspace as You Code
extension in your system browser by clicking ![]() in the Baseline,
Configuration, or Quality Monitoring
view.
in the Baseline,
Configuration, or Quality Monitoring
view.
Configure Checkers and Other Settings
Polyspace as You Code checks for a default subset of defects, but you can expand the set of checkers and perform other configuration through the Polyspace as You Code extension settings in Visual Studio.
For example, you can:
Enable or disable certain checkers. See Configure Checkers for Polyspace as You Code in Visual Studio.
Review only new results. See Set Baseline Polyspace as You Code Results in Visual Studio.
To open the extension settings, select Tools > Options to open the Options dialog box, and then select the Polyspace as You Code node. For the full list of settings, see Configure Polyspace as You Code Extension in Visual Studio.