Cross-Correlation of Phase-Lagged Sine Wave
This example shows how to use the cross-correlation sequence to estimate the phase lag between two sine waves. The theoretical cross-correlation sequence of two sine waves at the same frequency also oscillates at that frequency. Because the sample cross-correlation sequence uses fewer and fewer samples at larger lags, the sample cross-correlation sequence also oscillates at the same frequency, but the amplitude decays as the lag increases.
Create two sine waves with frequencies of rad/sample. The starting phase of one sine wave is 0, while the starting phase of the other sine wave is radians. Add white noise to the sine wave with the phase lag of radians. Set the random number generator to the default settings for reproducible results.
rng default

t = 0:99;
x = cos(2*pi*1/10*t);
y = cos(2*pi*1/10*t-pi)+0.25*randn(size(t));
Obtain the sample cross-correlation sequence for two periods of the sine wave (10 samples). Plot the cross-correlation sequence and mark the known lag between the two sine waves (5 samples).
[xc,lags] = xcorr(y,x,20,'coeff');

stem(lags(21:end),xc(21:end),'filled')

hold on
plot([5 5],[-1 1])

ax = gca;
ax.XTick = 0:5:20;
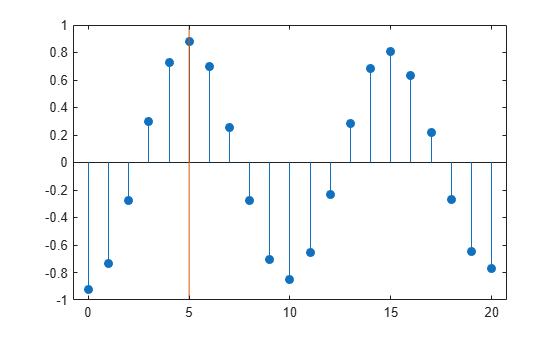
You see that the cross-correlation sequence peaks at lag 5 as expected and oscillates with a period of 10 samples.