Estimate Frequency Response at the Command Line
This example shows how to estimate the frequency response of a Simulink® model at the MATLAB® command line.
Open the Simulink model.
mdl = 'scdplane';
open_system(mdl)
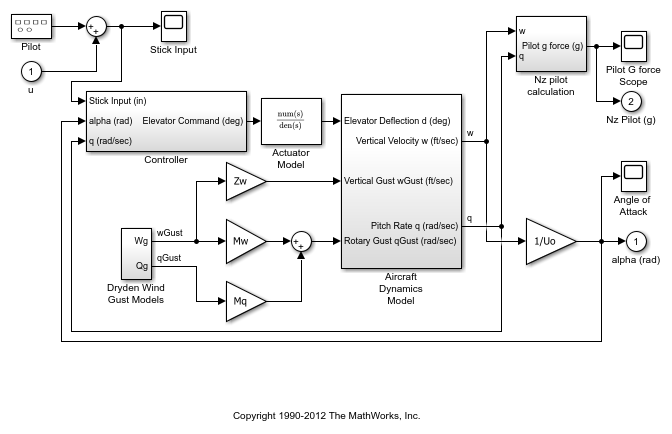
For more information on the general model requirements for frequency response estimation, see Model Requirements.
Specify input and output points for frequency response estimation using analysis points. Avoid placing analysis points on bus signals.
io(1) = linio('scdplane/Sum1',1);
io(2) = linio('scdplane/Gain5',1,'output');
For more information about linear analysis points, see Specify Portion of Model to Linearize and linio.
Linearize the model and create a sinestream signal based on the dynamics of the resulting linear system. For more information, see Estimation Input Signals and frest.Sinestream.
sys = linearize('scdplane',io);
input = frest.Sinestream(sys);
If your model has not reached steady state, initialize the model using a steady-state operating point before estimating the frequency response. You can check whether your model is at steady state by simulating the model. For more information on finding steady-state operating points, see Compute Steady-State Operating Points.
Find all source blocks in the signal paths of the linearization outputs that generate time-varying signals. Such time-varying signals can interfere with the signal at the linearization output points and produce inaccurate estimation results.
srcblks = frest.findSources('scdplane',io);
To disable the time-varying source blocks, create an frestimateOptions option set and specify the BlocksToHoldConstant option.
opts = frestimateOptions;
opts.BlocksToHoldConstant = srcblks;
Estimate the frequency response.
[sysest,simout] = frestimate('scdplane',io,input,opts);
sysest is the estimated frequency response. simout is a Simulink.Timeseries object representing the simulated output.
To speed up your estimation or decrease its memory requirements, see Managing Estimation Speed and Memory.
Open the Simulation Results Viewer to analyze the estimated frequency response.
frest.simView(simout,input,sysest)
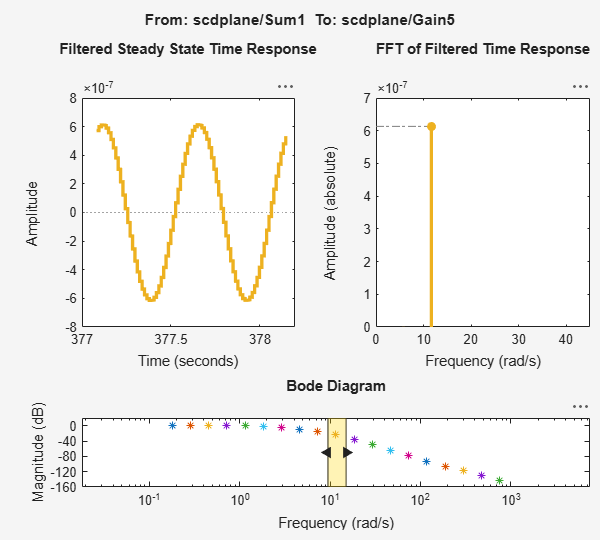
You can also compare the estimated frequency response, sysest, to an exact linearization of your system, sys.
frest.simView(simout,input,sysest,sys)

The Bode Diagram plot shows the response sys as a blue line.
See Also
linio | operspec | findop | frest.findSources | frestimateOptions | frestimate