Simulink Real-Time Explorer
Interact with target computer and real-time application running on target computer
Since R2020b
Description
Simulink Real-Time Explorer provides a single point of contact for viewing connection status and interacting with a real-time application. You can monitor and trace signals, tune parameters, and stream data to the Simulation Data Inspector.
Note
Do not use Simulink external mode while Simulink Real-Time Target Explorer is running. Use only one interface or the other.
Use Simulink Real-Time Explorer for these tasks:
Connect the development computer and target computer.
Load, start, and stop a real-time application on target computer.
View real-time application parameters and signal hierarchy.
Select real-time application signals for streaming to the Simulation Data Inspector.
Set real-time application stop time.
View task execution time (TET).
For examples, click the links in the More Information column.
Target Computer Configuration
| Capability | More Information |
|---|---|
Configure target computer configuration settings. View target computer disk usage. |
Real-Time Application Access and Control
| Capability | More Information |
|---|---|
|
Real-Time Application Management
| Capability | More Information |
|---|---|
By using Configuration tab or right-click menu in Targets tree:
|
Signal Access
| Capability | More Information |
|---|---|
Filter and group hierarchical signals. | |
Monitor signals. | |
Create, save, and load signal groups. | Export and Import Signals in Instrument by Using Simulink Real-Time Explorer |
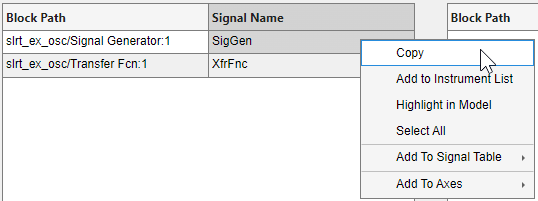
Copy signal block paths, add to instrument list, highlight in model, add to signal table, or add to axes. | See Simulink Real-Time Explorer, Signals Tab, Signal Context Menu. |
Simulink Real-Time Explorer, Signals Tab, Signal Context Menu
Parameter Tuning
| Capability | More Information |
|---|---|
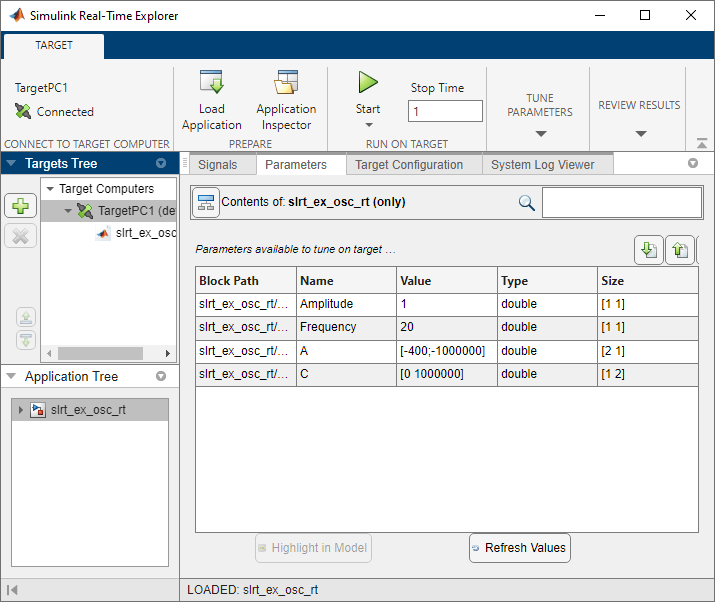
Filter and group hierarchical parameters. | |
Display and tune parameter values while the real-time application is running. | |
When the ECU page and XCP page selections do not match, the mismatch disables the explorer Parameter table. You can enable parameter table operation by coordinating ECU page and XCP page selection in the real-time application. Use the explorer Enable Parameter Table button. This button is context sensitive and appears when explorer detects a page selection mismatch. | |
Refresh cached parameter table values by clicking the Refresh Values button. | Use the Refresh Values button for instances in which the parameter table data becomes disabled (for example when page switching occurs), |
Use the Hold Updates button and Update All Parameters button to change multiple parameter values simultaneously. These buttons in Explorer operate in the same way as these buttons on the Real-Time tab in the Simulink Editor. | Tune Parameters by Using Hold Updates and Update All Parameters |
| Use the Save Param Set or Load Param Set buttons on the Parameters tab to save or load a parameter set file for the current real-time application. You can save or load the parameter set file from the development computer or target computer. See the figure. | Save and Reload Parameters by Using Simulink Real-Time Explorer |
Monitor Task Execution Time and Target Computer Status
| Capability | More Information |
|---|---|
Open the TET Monitor tab and monitor task execution time. | |
Open the System Log Viewer tab and monitor the target computer system messages. | |
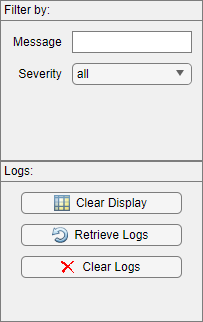
Open the System Log Viewer tab and use the log controls to filter messages, clear the display, clear the messages, or retrieve messages from the target computer. |
Open the Simulink Real-Time Explorer App
From the Simulink Editor, in the Real-Time tab, select Prepare > SLRT Explorer. Or, from the MATLAB® Command Window, type:
slrtExplorer
Examples
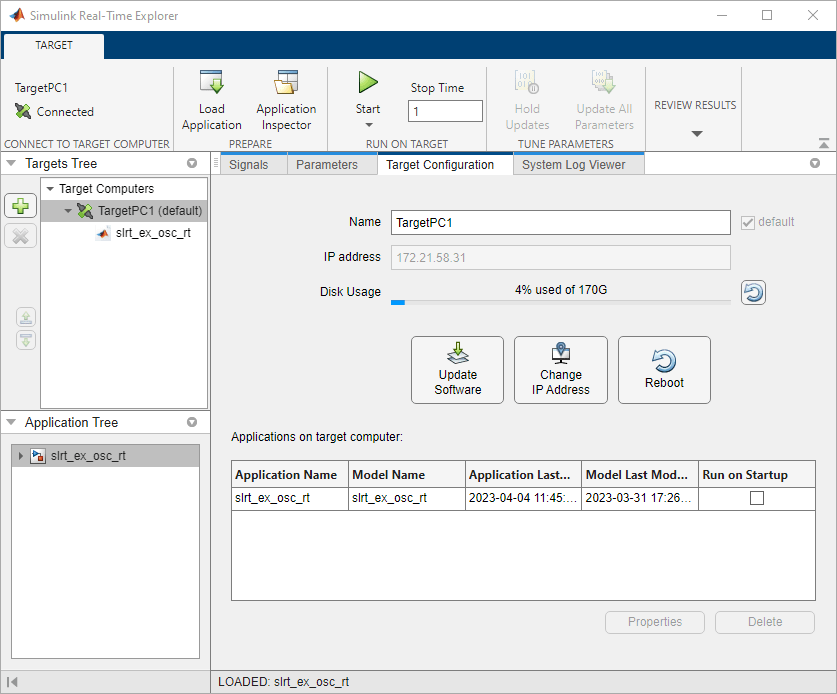
Configure Target, Update, and Reboot
This example shows how to change the IP address of the target computer, update the target computer software, and reboot the target computer.

Open the Simulink Real-Time Explorer.
Select the target computer in the Targets Tree panel.
To change the IP address of the target computer, click the Change IP Address button.
To update the target computer software, click the Update Software button.
To reboot the target computer, click the Reboot button.
Connect, Load Application, and Start
This example shows how to connect to the target computer, load the real-time application, set the stop time, and start the real-time application.
Open the Simulink Real-Time Explorer.
Select the target computer in the Targets Tree panel.
To connect to the target computer if not already connected, click Disconnected toggling it to Connected.
To select and load a real-time application, click Load Application and select the MLDATX file.
Note
You can select and load a real-time application by using the context menu. Right-click on the application and select Load.

To select the application stop time, type a value (in seconds) in the Stop time field.
To start the application, click the Start button.
In Explorer, clicking the Start button is equivalent to executing this command for target object
tg:start(tg, 'ReloadOnStop', true, 'AutoImportFileLog', true)
Note
To change the
ReloadOnStopandAutoImportFileLogoperation of the Start button, you can:Select Start > ReloadOnStop
Select Start > AutoImportFileLog.
Note
To change the
AutoImportFileLogoperation of the Stop button, you can:Select Stop > AutoImportFileLog.
To stop the real-time application, click the Stop button.
Filter, Clear, or Retrieve System Messages
This example shows how to filter the messages displayed by the System Log Viewer tab. You also can clear the log display in explorer, clear the log messages from explorer, or retrieve the log messages from the target computer. The tab provides filter selections for message severity and buttons that let you Clear Display, Retrieve Logs, or Clear Logs. These operations also are available in a right-click context menu for the message area of the tab.
Open the Simulink Real-Time Explorer.
Connect to a target computer. Load and run a real-time application. For more information, see Connect, Load Application, and Start.
Select the System Log Viewer tab.
Use the tab controls to filter the system log message display by message severity.
While the target computer status is
'loaded','loading', or'running', you can clear the display of log messages or retrieve log messages from the target computer.While the target computer status is
'stopped', you can clear the log messages from the System Log Viewer.Right click on a message in the System Log Viewer, and use the right-click context menu to clear the display, retrieve logs, or clear logs.
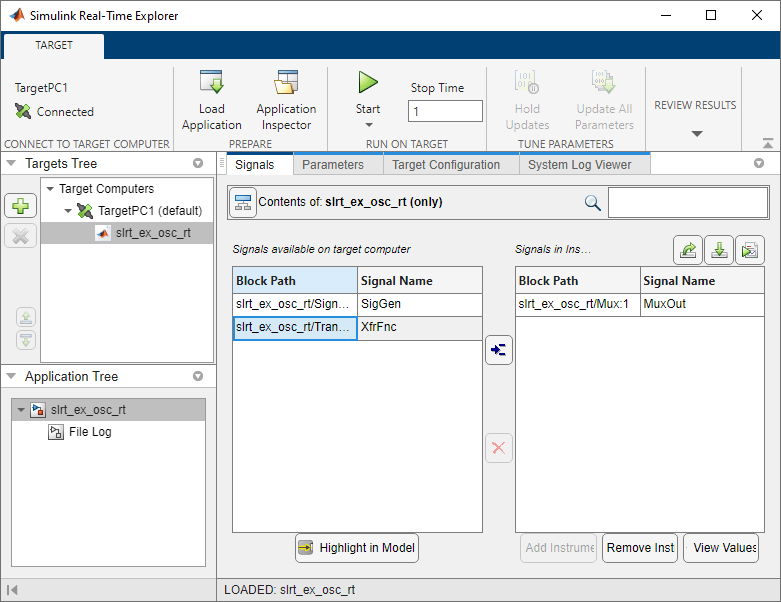
Select Signals and Stream Data to the Simulation Data Inspector
This example shows how to connect to the target computer, load the real-time application, select signals for a signal list, start the real-time application, and view the streaming data in the Simulation Data Inspector.
Open the Simulink Real-Time Explorer.
To connect to the target computer if not already connected, click Disconnected toggling it to Connected.
To select and load a real-time application, click Load Application and select the MLDATX file.
To select signals for streaming, click the application name, select signals from the Signals tab, and click the Add selected signals button.
To run the application and generate data for streaming, click the Start button.
To stream the signal data, select the signals in the Signals in instrument list and click the Add Instrument button.
To view the streaming signals, click the Data Inspector button.
To stop streaming and logging signal data, click the Stop Recording button. This button also stops signal logging.
After viewing the data, to stop the real-time application, click the Stop button.
Customize Instrumentation Display
To customize the instrumentation display in explorer, use the Instrumentation button to:
Add signal tables, parameter tables, and axes as custom instrumentation tabs in explorer.
Bind signals and parameters to the custom instrumentation tabs by using the Signal Selector button and the Parameter Selector button.
Configure the display of signals that you bind to custom axes.
Add a task execution time (TET) monitor tab to explorer.
Export or import custom instrumentation display configurations in explorer.
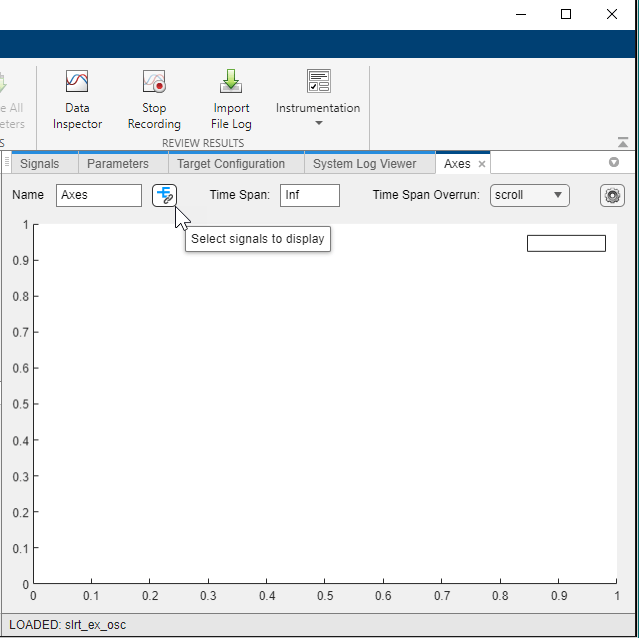
This example shows how to add and configure custom instrumentation (an axes display).
Open the Simulink Real-Time Explorer.
Select the target computer in the Targets Tree panel.
To connect to the target computer if not already connected, click Disconnected toggling it to Connected.
To select and load a real-time application, click Load Application and select the MLDATX file.
To add an Axes tab, pull down the options for the Instrumentation button and select the Axes button.
Use the controls in the Axes tab to name the tab and set features for the axes. Bind signals to the axes by using the Signal Selector button.
To export the custom instrumentation configuration, pull down the options for the Instrumentation button and select the Export Configuration button.
To import the custom instrumentation configuration in another explorer session, pull down the options for the Instrumentation button and select the Import Configuration button.
Programmatic Use
Version History
Introduced in R2020bSee Also
slrtExplorer | slrtLogViewer | slrtTETMonitor
Topics
- Target Computer Settings
- Real-Time Application and Target Computer Modes
- Configure and Control Real-Time Application by Using Simulink Real-Time Explorer
- Display and Filter Hierarchical Signals and Parameters
- Monitor Signals by Using Simulink Real-Time Explorer
- Export and Import Signals in Instrument by Using Simulink Real-Time Explorer
- Tune Parameters by Using Simulink Real-Time Explorer
You can also select a web site from the following list:
Americas
- América Latina (Español)
- Canada (English)
- United States (English)
Europe
- Belgium (English)
- Denmark (English)
- Deutschland (Deutsch)
- España (Español)
- Finland (English)
- France (Français)
- Ireland (English)
- Italia (Italiano)
- Luxembourg (English)
- Netherlands (English)
- Norway (English)
- Österreich (Deutsch)
- Portugal (English)
- Sweden (English)
- Switzerland
- United Kingdom (English)