Mask Atomic Subcharts and Boxes in Stateflow
An atomic subchart is a graphical object that you can use to create independent subcomponents in a Stateflow® chart. Charts in a library can be masked. Copying a masked chart from a library into a Stateflow chart creates a linked atomic subchart that retains the mask and the mask features. For more information about creating or using linked atomic subcharts, see Create Reusable Subcomponents by Using Atomic Subcharts.
An atomic box is a graphical object that helps you encapsulate graphical, truth table, MATLAB®, and Simulink® functions in a separate namespace. For more information about atomic boxes, see Reuse Functions by Using Atomic Boxes.
Using masks with linked atomic subcharts or boxes allows you to control the parameters for various inputs and outputs to your system at the chart level. Masking is helpful for systems that incorporate reusable components, because you can customize parameters to fit distinct use cases. You can create an interface for each instance of a linked atomic subchart, and configure each component to meet the needs of applications in the system. This adaptability allows you to reuse components and fine-tune the behavior of each instance of the subchart.
Masking an Atomic Subchart
In this example, you create a masked atomic subchart that represents a control system that warns you if an engine overheats. The subchart contains three states. By default, the chart starts in state NORM. If the engine temperature rises above 190 degrees, WARN becomes the active state. If the temperature rises above 225 degrees, ALARM becomes the active state. If the temperature lowers to a point equal to or below these cutoff temperatures, the previous state becomes the active state again.
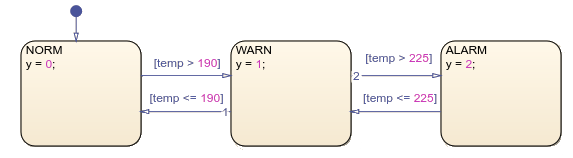
In this chart, temp is the parameter, and y is the output data.
Create a Masked Atomic Subchart
To open the library, at the command prompt type:
openExample('stateflow/EngineTemperatureMaskingExample')First unlock the library, and select the chart. In the State Chart tab, click the Create Mask button. The mask editor appears. For more information about the mask editor capabilities, see Mask Editor Overview (Simulink).
In the Controls pane, use the Edit button and add one parameter for the temperature. After you add the parameter, you can edit the prompt and the name.

The Prompt column shows the text that appears in the block dialog box for the block mask. The Name column is the name of the parameter data.
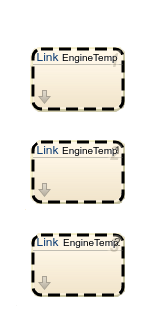
Click the Save Mask button and close the mask editor. In the library, the block icon includes a gray arrow in the lower-left side. This arrow indicates that there is a mask on the chart.

Create a Model with a Masked Atomic Subchart
To add this masked chart as an atomic subchart to your Simulink model:
Open a new Stateflow chart.
Set the chart decomposition to parallel.
Copy the library chart to the Stateflow canvas three times.
In the Symbols pane, create three outputs for the Stateflow chart and name them y1, y2, and
y3. In the Property Inspector, specify
the size as 1 and the type as double
for each output.
To update the temperature parameter for each instance of the chart, double-click the atomic subchart. The Block Parameter window appears. In the Parameters tab, you can update the engine temperature.
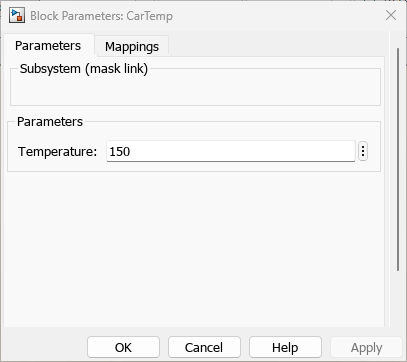
Set the temperature for EngineTemp to be 150, set
EngineTemp1 to 191, and set
EngineTemp2 to 275.
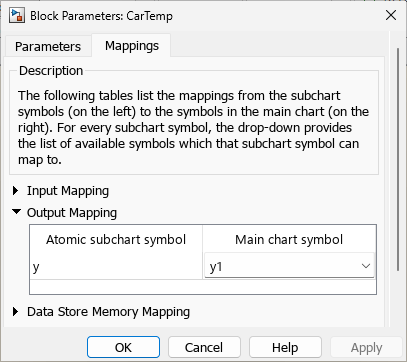
In the Mappings tab for each atomic subchart, map the
EngineTemp output y to y1 in the
main chart, map the EngineTemp1 output y to
y2 in the main chart, and map the EngineTemp2 output
y to y3 in the main chart. Mapping your output data
ensures that each atomic subchart has its own signal to the Scope
block.
In the Simulink canvas, connect each output to a Scope block. In the block, select View > Layout and select three columns.
View the Results
After running the model, open the Scope block.
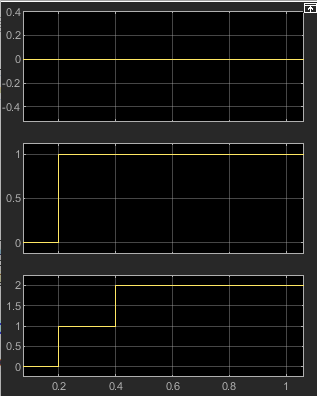
The Scope block shows that for the first atomic subchart, NORM is the
only active state because the temperature is low. For the second atomic subchart, the active
state moved to WARN. In the third subchart, the high temperature caused
the chart to enter the ALARM state.
Add an Icon to the Mask
To customize the appearance of the atomic subchart mask icon, you can draw an icon using the Graphical Mode tab or load a DVG image. For more information, see Graphical Icon Editor Overview (Simulink). To load an icon image to your mask, right-click the masked library chart and, in the Create Mask row, pause on the arrow, and then click Add Image.
Note
For a masked atomic subchart, you can only upload a DVG image or draw an icon in Graphical mode.
Limitations
Masked atomic subcharts do not support:
Self-modifiable masks.
Drawing Commands tab.
Undo or redo in the Mask Dialog.