How to Develop Custom Charts and Components for your App | Modular Apps in MATLAB, Part 3
From the series: Modular Apps in MATLAB
Learn how to modularize your app's user interface by creating custom charts and components. Reusable charts and components are easily shared, and components may be added to the App Designer component library.
Published: 6 Dec 2022
In this series, we're teaching modularization techniques to efficiently develop advanced applications in MATLAB and App Designer.
Modularization will enable you to develop apps that are scalable, robust, testable, and well-organized. Developing and maintaining apps while managing complexity can be challenging. You might start out with a simple prototype but keep adding features until your app becomes unwieldy. Perhaps your work progresses to a point of team-based development, where modularization becomes essential. Your app might have become large enough that testing and validation for new releases is a burden.
When you first begin analyzing data in MATLAB, you typically start at the Command Window or begin writing a script. Once you have a few lines of code that do what you need, you might change your script into a function that you can reuse. As you become a savvier programmer, you may convert this into a class to better organize your work.
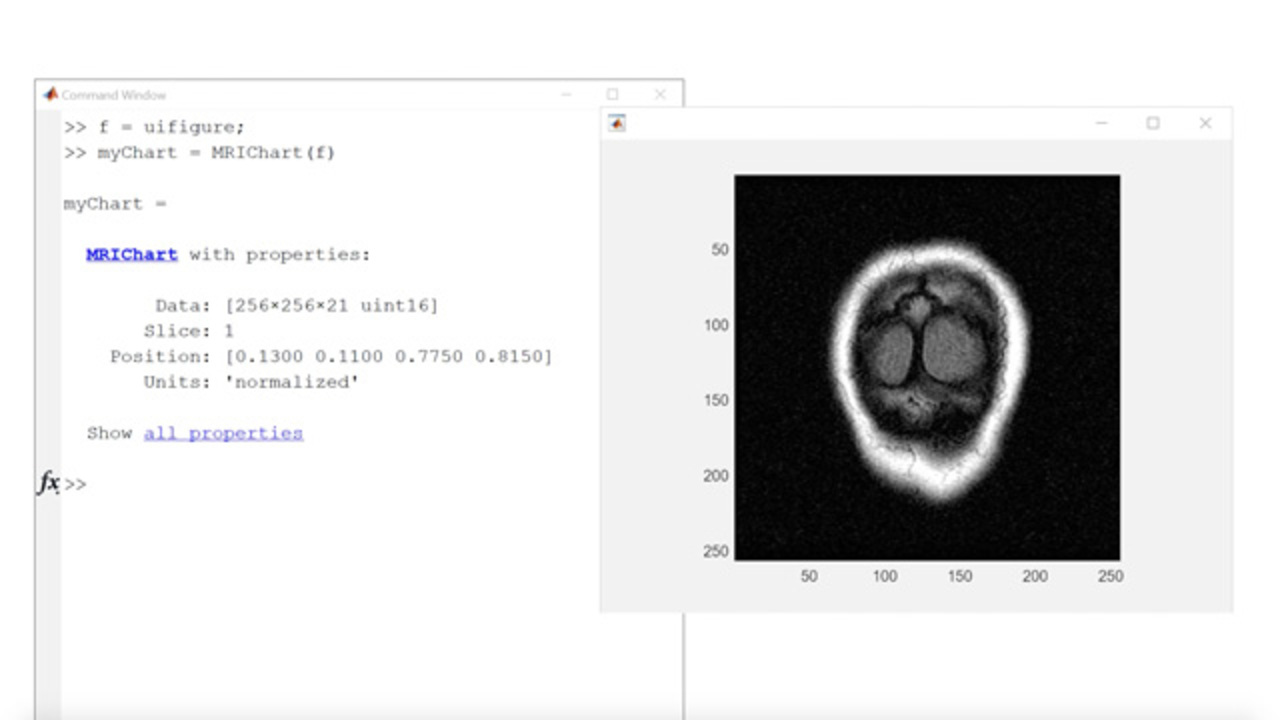
For reusable visualizations, an even better way to do this is by creating a custom chart. This is the best way to format a new and specialized type of plot that you've created as something that is easily reusable for your own work or to share with others. Here's a custom chart that displays medical imagery on an axes. To update the content, you can modify the properties of the chart object. I can change the Z-slice displayed by simply setting the Slice property. I can also change the data being displayed by setting the Data property.
If you want to convert your MATLAB plot into a custom chart start with a class definition file inheriting the built-in chart container class. First, define the interface-- the public properties that you want the user to interact with. Then, decide what happens during setup, the initial creation of the chart. We might need some internal properties to store the graphics created.
Lastly, implement the update method that runs based on changes happening to the chart. The custom chart includes the default axes interactions, like Pan and Zoom, and you can customize this axex toolbar if you like. But what if you want to include app controls, like a slider to control the slice?
When you need to start including controls, then you need to switch to a custom component. A custom component can include app controls like Edit boxes, sliders, and buttons, in addition to axes. If you are just adding a couple of controls, App Designer maybe your preference for building the component. You can drag these in from the Component Library and customize the properties in the Component Browser. Building your component directly in App Designer works best when the controls needed are static, but the data display may still change.
However, if your component must be able to dynamically add or remove controls, then I recommend exporting it to plain code outside of App Designer. You can configure the component to place it into App Designer's component library. Here's an example that has been authored outside of App Designer. The class MRIComponent inherits componentcontainer.
In our setup method, we created a UI grid layout to position the contents. The grid has a 1 by 2 configuration where the first column is 50 pixels and the second column is scaled to take up the remaining space. Then, we placed a slider first within the grid, and we assigned some callbacks. Next, we created an axes in the second grid position. On the axes, we placed our imagery.
The public properties of the component remain the same as we had in the chart we showed earlier. In our update method, we've added some code to update the slider according to the number of slices in the data. So we've discussed two different containers to help modularize your work. Let's review the purpose of each.
A custom chart is intended for a reusable visualization on axes. A custom component is intended for a reusable group of controls for your MATLAB app. You can find plenty of examples of these using the MATLAB File Exchange or Add-Ons Browser, like the Widgets Toolbox and Chart Development Toolbox.
Building and using custom components enable you to develop professional-quality apps through code reuse. As a consultant, I've helped clean up many users' apps where duplicate code was copied and pasted throughout. Take the time to make your code modular and reusable. This will prevent you from wasting time fixing and maintaining buggy code.
In a future video, we'll also talk about testing your apps, charts, and custom components. Modular work is easily testable so that your apps will be reliable and high-quality. For more information about building apps in MATLAB, check out the links in the description. You can also sign up for our professional training classes and get engaged with a MathWorks consultant like me to help ensure you're optimizing your app designs. Thank you for watching.
Related Products
Learn More


Select a Web Site
Choose a web site to get translated content where available and see local events and offers. Based on your location, we recommend that you select: United States.
You can also select a web site from the following list
Americas
- América Latina (Español)
- Canada (English)
- United States (English)
Europe
- Belgium (English)
- Denmark (English)
- Deutschland (Deutsch)
- España (Español)
- Finland (English)
- France (Français)
- Ireland (English)
- Italia (Italiano)
- Luxembourg (English)
- Netherlands (English)
- Norway (English)
- Österreich (Deutsch)
- Portugal (English)
- Sweden (English)
- Switzerland
- United Kingdom (English)