How to Optimize the User Experience of Your MATLAB Apps
With MATLAB®, non-professional software developers can develop professional applications. However, creating visually appealing and user-friendly applications requires design considerations which might elude the engineer who is—rightfully—focused on the app’s functionality rather than aesthetics or usability aspects. Nonetheless, an easy-to-use app is always desirable and sometimes a requirement when the app needs to be published.
In this presentation, learn tips and tricks to design appealing and user-friendly apps with MATLAB, such as:
- customizing graphics objects
- resizing the app components to fit every screen
- exploiting every corner of the canvas space
- using custom HTML components inside the application
Published: 7 May 2023
Hello, everyone and welcome to MATLAB EXPO. I hope that you're enjoying this event as much as I do. My name is Gianluca Carnielli, and I'm an application engineer at MathWorks. For the past three years I've supported customers in almost any industry to develop software with MATLAB, focusing on applications with a graphical user interface.
Before we start, I would like to remind you that if you want to share your experience at MATLAB EXPO on social media, then be sure to include the hashtag MATLABEXPO in your post. In this presentation, I'm going to tell you what you need to make a great MATLAB app, in terms of the user experience, an aspect that has important consequences but is sometimes overlooked.
So what is user experience in this context? Essentially, it's how the user perceives the use of an app, how easy it is to learn it, how intuitive it is, how it looks, and so on. Let's do a simple exercise. I'm going to play two videos, one after the other.
Each video will show an app for analyzing some data from a test flight. And you don't need to bother about a specific application here. What I would like you to do is to think, which one provides a better user experience. Here's the first version of the app.
We start by interactively loading some data found on our local PC. And we visualize this data into the user interface. We then analyze it. So we run some analysis, plot the results into the UI. And finally, we export the results to an external MAT file.
And here's the video showing the second version of this application, which is very similar to the first one. Again, we interactively load some data found on our local PC, visualize it from within the application, go on and analyze it, and plotting the results into the UI, and finally, again, exporting the results to our local PC to an external MAT file and get a confirmation message at the end.
So the two applications are doing the same thing. They load some data, analyze it, and store the results. But they look different. For example, the first one is cluttered and it doesn't provide any sort of feedback. Instead, the second one is more user-friendly and it looks more professional.
So what I'm going to show you in this presentation is how you can work to transition from one version of the application to the second one. More specifically, you're going to learn the tools and techniques available in MATLAB that you can use to make your apps more user-friendly.
One of the point that I will also make, which is going to be one of the take home messages for this presentation, is that great applications come from a great user experience. Of course, great apps have also other qualities, like that of having a robust implementation or a design architecture which guarantees easy maintainability and scalability for example.
And if you are interested to learn more about this topic then I've included a few links in the handout. But for today, my focus will be on the aspect of user experience, which is something that might elude the engineer's mind. So why do I say that?
Here's a challenge. As engineers and scientists, we are problem solvers. So what we want our app to do, first and foremost, is to solve a problem. And this is right, but it's not all there is. As app developers, we should have our end user in mind, and we should aim to make their life easy when they use our application. Otherwise, they might struggle to use it. They might not be happy. And as a result, their productivity will decrease.
Also the user experience is going to affect all end users, so its impact increases proportionally. Just to give you the perspective on the importance of user experience, at MathWorks we have over 100 professional working on optimizing the user experience of the MATLAB and Simulink platforms.
But here's a second challenge. How do you do it in practice? Here's a list of actions that you can take to improve your MATLAB app, in terms of the user experience, and take them to the next level. So here's what we are going to do. We are going to consider each action individually, see how it helps, and then learn how to apply to a MATLAB app.
Let's start from the first action, that is to choose the correct position and size of the graphical components. When you create an app, you've got to decide where each component goes, the buttons, the axes, and so on. Ideally, at any time in the app, I should see what's relevant for that moment, and what's most important should be easily accessible.
Let's take the example of the first application that I showed you. What's a problem here in terms of the position and size? Well considering it's a data analysis application, probably the first thing you want to do when you start the application is to load data. Now look at the application and notice how much space the loading part takes. It's just a small percent.
What gets in the way is all the rest that's being displayed, namely the five axes, the buttons, the app title, and so on. So this adds extra effort to navigate the app, which is not ideal. What we can do in this case is to separate things out. For example, we could have the loading and analysis processes separated into different parts of the application.
For the loading process, I would like the app to intuitively guide me through the steps of loading data into the app. And once data is loaded, I would like to visualize it right away. So here's how something like this could look like. We have a dedicated tab to import the data into our application.
And once the data is loaded, we right away visualize it into the canvas. And we optionally specify which plot we want to focus our attention on. So there's a number of things that I would like you to notice from this alternative version of the application. First is that I move the app's title from the canvas to the window bar. It's just neater.
Second is that when we run the application, it's immediately obvious what we need to do and how. We need to load data. And we do it by pressing that big prominent button in the middle of the screen. And prominent is the keyword here. I made what's relevant big enough to be easily seen by the user, playing also with a font size of the button.
The second aspect I want you to notice is that all the plots and other buttons that were present in the original version are not immediately visible here. Can you guess where we analyze the data in this new version, and where we can save the analysis results?
So I've used tabs and menu to effectively separate the different parts of the workflow and to show only what's relevant. Another option could be a toolbar. But in this case, I decided to go with the UI menu instead. So let's watch this first and then let's make some considerations about the plots.
So in this new version, we have a separate tab for analyzing the data that we have loaded. And optionally, we can decide again on which plot we want to focus our attention on. And we have a menu for storing the results to an external file.
So as you might have noticed, the analysis part has now its own tab, similar to that for loading data. And the Save option is included inside a menu in the top left. Why did I put it there? Mainly because saving can occur at any time after analyzing the data. So it needs to be easily accessible irrespective of the tab in which we find ourselves. But it's also because having the Save option in the File menu is a standard. So you will find it in many other applications.
And as a result, it's going to be more intuitive for the end user to find it. Usually menus are also a good place to give access to advanced features that are frequently accessed by the end user. And as a side note, tabs can be the ideal tool to transform a multi window app with one with a single window, which is actually needed when you deploy your application to a web app.
There's a couple of more aspect that I would like you to consider from this version of the app. One is how the display of the plot was managed. In the spirit of showing only what's necessary, using some checkboxes, I've implemented a possibility to decide which plots to display, since I might be interested to look at some specific input data.
And if you paid careful attention, you'll notice that the size of each plot is automatically adapted based on the available space. This was achieved using a MATLAB object called a Tight Layout, which is essentially a container that works out for us the best way for positioning a certain number of axes.
The nice thing is that we can dynamically add or remove axes into our app. And we won't need to care about resetting their position. Last but not least, there is an invisible actor inside the application which makes everything robust from a positioning perspective. It ensures that, upon window resizing, each component will rescale exactly in the way we want. And it also allows to display and hide graphics objects, automatically adapting their position.
This actor is the grid layout, and it should pervade the canvas space. Technically, it's a container that you insert in your app before inserting the graphics objects. So in technical terms it acts as a parent. One note I would like to make is that it's likely that inside your app you're going to have quite a few of these.
For example, in this app snapshot, there are three grid layout objects, one to host the tab group, another one to host the content of each tab, and finally one to host the checkboxes under the button on top. This combination ensures that, for example, when the window size is maximized, the button and the checkboxes remain centered and of the same size, while the size of the access gets maximized.
Coming back to the videos, have you wondered how the transition from the big central button to the plots was managed? So at some point, the big button disappeared and was replaced by the axes. But I have not changed tab. So what I did is I've hidden that part of the app, which contains the central button. And I've made visible the other part, which contains the plot, the checkboxes, and the Delete button.
So nothing was created nor destroyed. And the way I managed this transition was using the grid layout. And for those of you who are curious to understand the details, I refer you to the handout that is provided with this session. Enough said about choosing the correct position and size.
Let's discuss another action that you can take to improve the user experience of your MATLAB app, potentially more straightforward. And that is to set the expectations. What do we mean by that? Let's answer by considering again an example from the application that we're working on improving.
Suppose it's the first time that you use this application. You might be wondering, what kind of data do I need to load, what kind of analysis am I going to run, is it safe to close the app without saving the results? So setting the expectation is about avoiding letting the user wonder. It's about ensure that when they use the app, they feel comfortable in using it.
There are different ways to achieve this. And here are some examples. We can add tooltips to the UI components, so that upon hovering with the mouse, the user is prompted with information on what to expect from that object. For example, for the load data button, a tooltip was added to let the user know that the file needs to be from a test flight, and that it needs to be stored locally.
For the analysis, the user reads what will be calculated and displayed once that button gets pressed. Notice that the screenshots on the right show a new graphical element inside the button. And that is the icon. Icons can give us an intuitive understanding of the functionality, hence making us feel more comfortable in using it. For the load data button, that icon intuitively makes us understand that it's going to be something that we need to provide and upload.
For the analysis button, the place symbol makes you understand that by pressing that button you will have to wait for something. To add icons to button and tooltips to UI components, the user needs to operate with the properties of the object. And the easiest way to access these properties is to use the dot notation on the handle object.
To help setting expectations, you can also implement a warning or a confirmation message that appears on the app screen. For example, if the user closes the app without saving the analysis results, a confirmation message appears on the screen warning the user about a potential issue. In MATLAB, you should use UI alert and UI confirm to issue this kind of window, so you do not need to create separate windows.
Dialog windows can actually be considered also a form of feedback that the user receives, which is the next action that you can take and which is next on our list. When we interact in the real world, we get feedback all the time through our senses, when we touch, when we look, and so on. So we naturally tend to expect feedback also when using software.
Can you think of a situation where you pressed the button in a program, and you've been left wondering whether it actually did anything or if the program was stuck? This is something that you don't like when it happens. To some extent, you might have experienced this also in the videos that I played before.
Between the time that I press the button to load or to analyze the data and the time when the plots appeared, there was a moment of suspense, which luckily for us was not very long, where nothing happened. This would be a time where the user needs feedback, namely those moments in which MATLAB is running calculations in the background. And we are left waiting.
In this case, we could implement a progress bar, and it could look like this. Note that a progress bar can be made indeterminate if we don't have any idea of how long the process is going to take, or it can be implemented as a progression if we know the process.
You can easily see how feedback reactions increase the perceived responsiveness of the app. This is how it looks without feedback. And this is how it looks with feedback. So you see, it feels more responsive. But feedback should be implemented in both ways. The app provides feedback to the user. And the user provides feedback to the app.
In this last case, feedback from the user can be collected in the form of a log file and will serve to understand how the app is being used, which helps to iterate on the design of the app itself with the intent of optimizing the user experience. This form of feedback can be implemented through a logger that records actions and events inside the app.
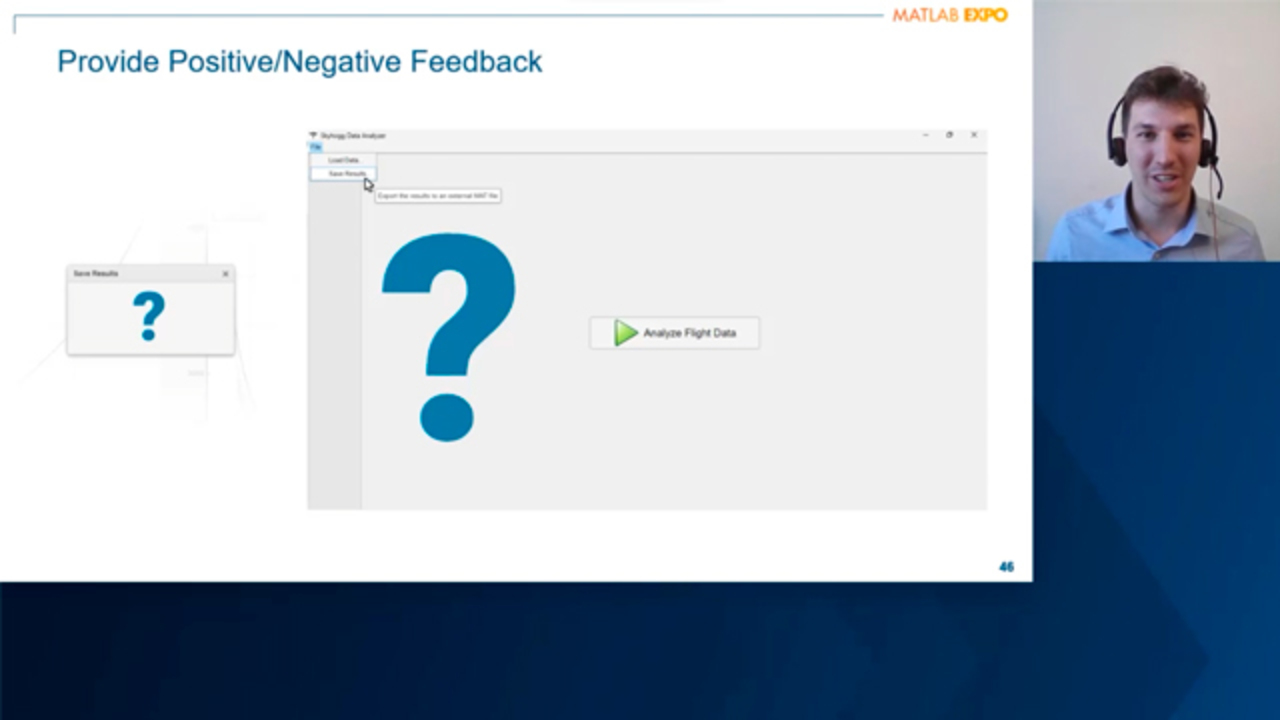
Of course, this can be developed from scratch in MATLAB, but if you go in a File Exchange, you will see some that are already out there, including a comprehensive one developed by MathWorks consultants. Coming back to the concept of providing feedback inside the app, this can also include positive and negative feedback in the form of pop up windows.
An example of positive feedback is issuing a confirmation message when a process successfully completes, such as date of exporting the analysis results. But what happens if I try saving the results before actually running the analysis? Hopefully I will not crash the app.
But rather than hoping that it doesn't happen, even better, let's make sure that it doesn't happen. For the sake of a great user experience, let's try to anticipate any misuse of our application. Let's consider, again, our latest version of the application and let's identify potential sources of user errors.
Suppose we have just started the application, and we yet need to load the data. Do you see any red flags in this app screenshot? For sure we shouldn't be able to press the Analyze data button, given that there is no data to analyze. Even more so, we shouldn't be able to export the results that do not yet exist.
But as it is, nothing prevents me from pushing those buttons. These objects should be initially disabled to prevent the user from accidentally pressing them. Like for any customization, UI components can be disabled and enabled when necessary by acting on the relevant property. We enable, again, the button to analyze data after loading. And we enable the Export option once data has been analyzed.
From a code perspective, there is also a strong weapon available to us, which allows to counteract any mistake or any sort of unexpected situation. Suppose we forget to disable the Save button at startup. The way to prevent any crash or error is by using what is called a Try/Catch statement block. Instead of try block, we try to execute some code, like exporting the results.
If this code generates some error, which will be the case if there is no data to export, then we catch the error, pretend it didn't happen from an execution point of view, take action based on the error message, and warn the user accordingly. For the case of saving simulation results before analyzing them, we could implement a combination of Try/Catch statement block, plus a UI alert, which would generate something like this.
Here we try to save the results, and we get the error message. So at this point, you would be right to think, OK, but this would have not happened had I known how this app works. And you'd be right. Your claim would be correct. The app is currently missing any sort of documentation that, for example, explains what kind of data needs to be loaded and how to use the app in general.
A possible solution is to write formal documentation using your favorite text editor and hand it over to the end user. But in the spirit of great user experience, I'm going to show you an example of how you can develop documentation in MATLAB and incorporate it directly inside the application.
Here's how it looks like. There is a tree on the left side, which provides an index, while under right, one sees the documentation pages that are, in fact, MATLAB live scripts, which have been exported to HTML files and incorporated inside the UI HTML component inside our application.
By consulting the documentation, the user learns how to use this app and how to load data, what kind of data needs to be loaded, for example. I know that writing documentation is not much fun and requires effort. But my strong advice would be to write it at least for those apps that are developed by multiple people, those that will be maintained over time, as well as apps that are targeted at many end users.
Since the documentation is especially useful the first time that we use the app, I have created a new introduction tab in our app that, upon startup, prompts the user to load data or to be redirected to the Documentation tab to get started.
So let's summarize what we have so far. We have a Startup tab, then one for visualizing test data, one for analyzing the test data, and the Documentation tab at the end. So from a functional point of view, all is good, and we have created a great user experience. The last aspect that claims its piece of cake is the appearance.
So the user experience is also influenced by the colors and aesthetics in general. Just think of the dark mode, which is getting ever more popular among developers. Sometimes having the app implementing a specific look and feel is a company requirement. And so we need to adapt our UI components to meet the required standards, in terms of aesthetics.
I'm going to show you one way in which this app can be customized, and here it is. This is the final version of our application. I'm not going to make any comments on the choice of colors, fonts, and so on. And by no means I claim that this is the best combination. What I would like to focus your attention on is actually the tabs on the left side.
If you pay careful attention, and if you've already used this in your MATLAB apps, you notice that they look different compared to the standard MATLAB tab group. Indeed, this is a custom tab group created with HTML, CSS, and JavaScript, which I've incorporated inside my application by using a UI HTML component.
And the point I would like to make here is that through the UI HTML component, you can integrate any other UI component that is based on HTML, CSS, and JavaScript. And this breaks the limit, in terms of how your apps can appear.
In the handout, I've included a link to download the source code of a JavaScript based button that you can use to build a tab group like the one that you see on the screen, and that you can use as a reference to learn how to integrate external HTML based components in your MATLAB app.
So in summary, we've taken a data analysis app from a state where it wasn't performing at its best, to say it in a few words, to a state in which provides a great user experience. And to achieve this, we've explored a number of tools and techniques that are available in MATLAB. And hopefully today you have discovered some new ones.
What I would like you to remember from today's talk is that MATLAB has all you need to develop professional grade applications with an optimal user experience, which will benefit the end users of your application, in terms of their productivity. And the call to action really is to go out there and use what you learn in today's session.
You can apply these concepts to apps that you have already developed, as well as apps that you yet need to develop. To learn more, I invite you to download a handout that I've mentioned a few times throughout the presentation, which summarizes the main concepts and goes into a bit more details for certain parts. Thank you for listening, and feel free to ask any questions you may have in the Q&A panel.
[AUDIO LOGO]
Featured Product
MATLAB


Select a Web Site
Choose a web site to get translated content where available and see local events and offers. Based on your location, we recommend that you select: United States.
You can also select a web site from the following list
Americas
- América Latina (Español)
- Canada (English)
- United States (English)
Europe
- Belgium (English)
- Denmark (English)
- Deutschland (Deutsch)
- España (Español)
- Finland (English)
- France (Français)
- Ireland (English)
- Italia (Italiano)
- Luxembourg (English)
- Netherlands (English)
- Norway (English)
- Österreich (Deutsch)
- Portugal (English)
- Sweden (English)
- Switzerland
- United Kingdom (English)