Using Deep Learning to Reduce Radiation Exposure Risk in CT Imaging
By Dr. Ryohei Nakayama, Ritsumeikan University
Because they produce 3D images of organs, bones, and blood vessels, computed tomography (CT or CAT) scans have significantly greater diagnostic value than simple X-rays. This added diagnostic value, however, comes at a cost: increased exposure to potentially harmful radiation. The 3D images produced by a CT scan are assembled from 2D X-ray images stacked together by computer software. As a result, a single CT scan of the chest has an average effective radiation dose of 7 milliseverts (mSv), 350 times higher than the chest X-ray dose of 0.02 mSv. [1] Radiation exposure is correlated with cancer risk; guidelines limit the radiation dose to 1.5 mSv in CT scans of children.
Medical researchers want to limit radiation exposure while providing physicians with the image clarity they need. One promising approach is the use of ultra-low-dose CT, which has an effective average dose of about 0.13 mSv for a chest image. [1] The principal drawback of ultra-low-dose CT scans is their relatively low resolution and high level of noise, which can make it difficult for physicians to see organs, fat, and interstitial tissue (Figure 1).
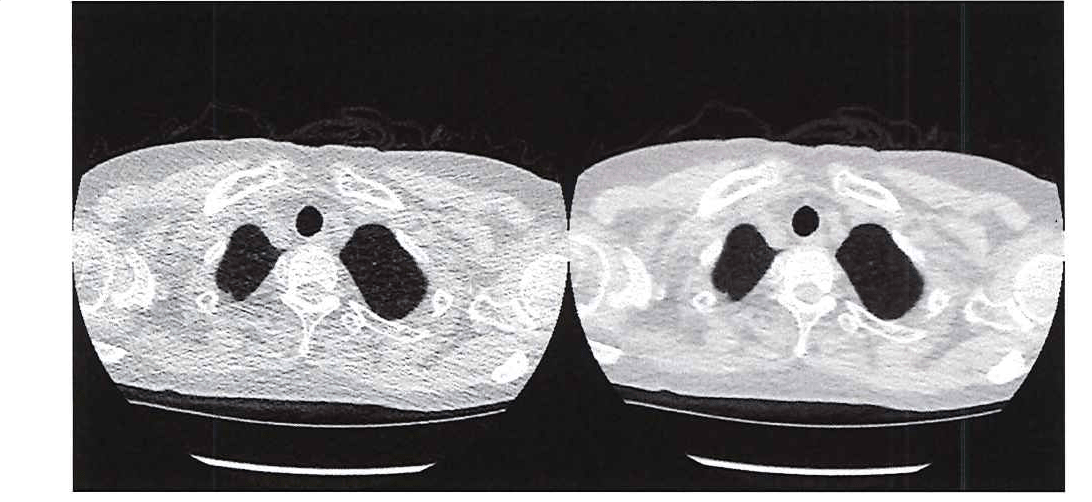
Figure 1. Comparing the image quality of ultra-low-dose CT (left) with a traditional CT (right).
I have developed a MATLAB® software system based on convolutional neural network (CNN) regression that uses ultra-low-dose CT scans as input but generates images comparable in quality to a normal-dose CT scan. The system provides physicians with a comparable level of diagnostic information while reducing patient radiation exposure by as much as 95%.
Super-Resolution vs. CNNs
When I began researching ways to improve the quality of low-dose CT images, I applied a super-resolution technique in which I used MATLAB to divide CT images into small local regions and then paired low-dose and normal-dose regions to create an image dictionary. When a new low-dose image is to be analyzed, the system finds a small low-dose region in the dictionary and presents the corresponding normal-dose patch to the user.
The technique's effectiveness depends on having a huge dictionary from which to draw comparisons. However, increasing dictionary size increases the resource demands of the system and, more importantly, the search time needed to find small images. While a CNN takes time to train, when presented with a new image it produces results much faster than the super-resolution approach I developed. For example, a trained CNN can yield results in about 20 minutes for a single patient, whereas it took about 2 hours to obtain comparable results using super-resolution.
Although I began exploring CNN regression to address the shortcomings of super-resolution, there are some cases in which the super-resolution technique performs very well. For example, when patterns in an image to be diagnosed closely resemble those in one of the dictionary images, the super-resolution approach produces highly accurate results. For this reason, I plan to create a hybrid system that combines CNN regression with super-resolution.
Obtaining Images and Constructing the CNNs
To improve the clarity of ultra-low-dose chest CT scans, I applied an approach that uses two CNNs, one targeting the lung areas of the CT images and the other targeting the non-lung area (Figure 2). The image data set that I used to train the CNNs was provided by researchers at Mie University. It consists of 12 image pairs, each of which includes a normal-dose scan and an ultra-low-dose scan of the same tissue. (Because taking a second image means exposing a patient to additional radiation, we had to limit the study to a relatively small subject pool.) Each image in the study was 512 x 512 pixels, and each scan contained 250 images (slices).

Figure 2. CNNs trained on lung and non-lung areas of the ultra-low-dose CT.
I based the initial structure of the CNN on the results of my earlier work on super-resolution. In that study, I found that a local region of 7 x 7 worked best, and I began with that size local region for my deep learning model. I subsequently experimented with local region sizes between 5 x 5 and 128 x 128, checking the clarity of the results each produced, before settling on 32 x 32 for lung area and 64 x 64 for non-lung area. Working in MATLAB, I also evaluated about 128 different CNN variants, trying different input sizes and filters as well as various numbers of convolutional layers.
Training and Validating the CNNs
Using cross-validation, I trained the model with images from 11 patients and tested it with images from the one remaining patient. I repeated these steps 12 times with different training sets and test images. To accelerate this process, I trained in parallel on multiple NVIDIA® GeForce series GPUs using Parallel Computing Toolbox™. To monitor training progress, I plotted accuracy and loss using the monitoring visualization option in Deep Learning Toolbox™ (Figure 3).
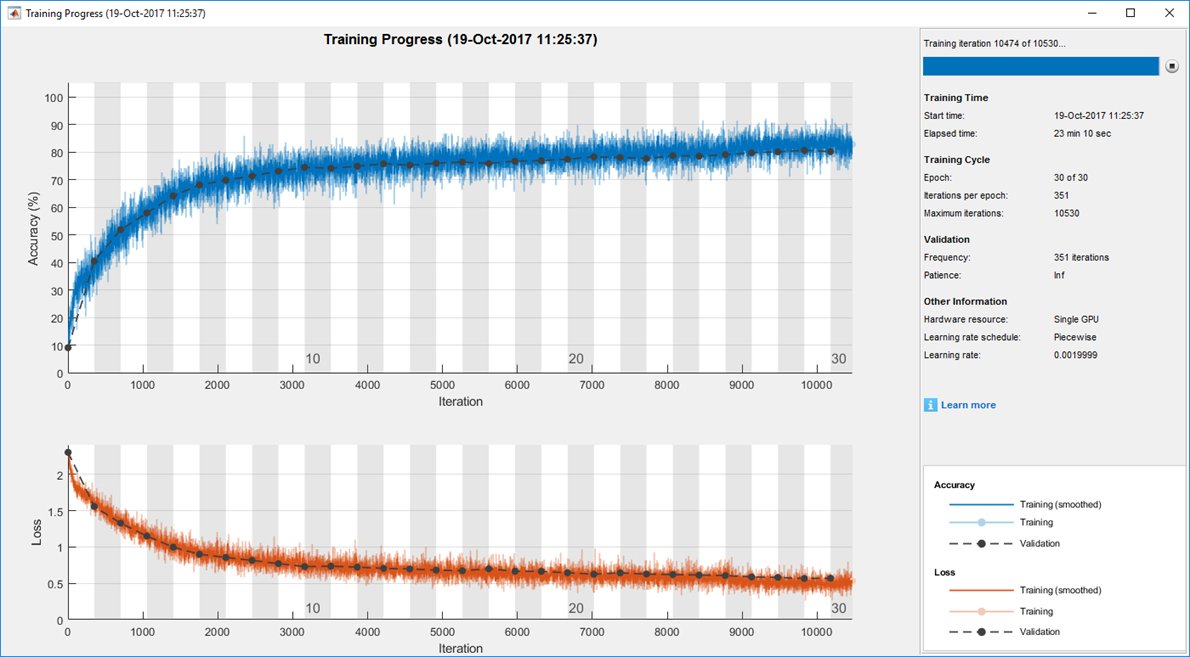
Figure 3. Sample plot of training progress, generated with Deep Learning Toolbox.
The results for each ultra-low-dose test image were evaluated against its corresponding normal-dose image using root-mean-square (RMS) levels and the structural similarity index (SSIM) for measuring image quality metrics.
Next Steps
Plans are in place to use my CNN-based system in an actual clinical setting. I am also exploring ways to deploy the system to a picture archiving and communication (PAC) server, which provides convenient storage of, and access to, medical images. One of the many advantages of developing medical imaging software in MATLAB is that the environment makes it easy to create an interface to the underlying algorithms and then distribute the entire package to doctors, a process that I have already completed for other MATLAB based systems that I’ve created.
Ritsumeikan University is among the more than 1000 universities worldwide that provide campus-wide access to MATLAB and Simulink. With the Total Academic Headcount (TAH) License, researchers, faculty, and students have access to a common configuration of products, at the latest release level, for use anywhere—in the classroom, at home, in the lab, or in the field.
Published 2018
References
-
"What are the Radiation Risks from CT?" U.S. Food and Drug Administration. https://www.fda.gov/radiation-emitting-products/medical-x-ray-imaging/what-are-radiation-risks-ct
-
Wang R, et al. "Ultralow-radiation-dose chest CT: accuracy for lung densitometry and emphysema detection." American Journal of Roentgenology (2015). 204: 743-749. 10.2214/AJR.14.13101. https://pubmed.ncbi.nlm.nih.gov/25794063/