Review Code Prover Results in Polyspace Platform User Interface
Polyspace® Code Prover™ checks C/C++ code exhaustively and proves the absence of certain types of run-time errors (static analysis or verification). After running the analysis, you open the results in the Polyspace Platform user interface.
This topic shows how to review Code Prover results in the Polyspace Platform user interface.
Note on terminology: In Polyspace documentation, ‘results’ refers to findings from any Polyspace product, while ‘RTEs’ (run-time errors) specifically denotes findings from Polyspace Code Prover. Since this tutorial focuses solely on Code Prover, the terms ‘results’ and ‘RTEs’ or 'run-time errors' are used interchangeably throughout.
Example Files
To follow the steps in this tutorial, you must have run Polyspace Code Prover on example files using the steps in Run Polyspace Code Prover on Desktop. Alternatively, to open a pre-analyzed project, on the toolstrip, select Help > Examples > Prove absence of C runtime errors.
If you open the results of the pre-analyzed project, the project name and the numbers shown in the screenshots below might differ from the exact numbers that you see. Nevertheless, you can follow the steps below to review the results.
Open Results
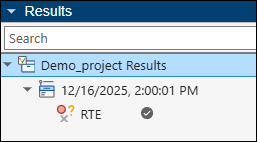
After a Code Prover run is complete, the Results pane on the left of the user interface shows an RTE node. Double-click this node to start your results review.
The results can be reviewed in one of two perspectives:
The Dashboard perspective shows an overview of the results. This is the perspective that opens when you double-click the RTE node. You can also get to this perspective by right-clicking the RTE node and selecting Open Dashboard.
The Review perspective shows details of each individual result, for instance, each issue found in the code. You can get to this perspective by right-clicking the RTE node and selecting Open Review.
In each perspective, you can select the name of the other perspective on the toolstrip to switch to the other perspective. You can also click on an item in the Dashboard perspective to open a filtered view of results in the Review perspective.
For more information on opening results, see Open Polyspace Results in Polyspace Platform User Interface.
See Overview of Results
The Dashboard perspective shows an overview of the results on various cards. For instance:
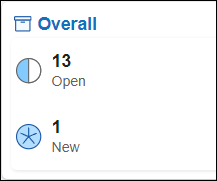
The Overall card shows how many run-time errors (RTEs) are open including those from the last run and how many new issues appeared in the current run. Here, run-time errors include red checks (proven run-time errors), orange checks (potential run-time errors), and gray checks (unreachable code).
For instance, the card below indicates that there is one new RTE found in the current run and there are 13 total RTEs combining open ones from the previous run and the new one found.
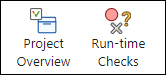
The Run-time Checks card shows the same information along with other metrics such as selectivity. The selectivity metric is defined as the number of checks that were green expressed as a percentage of the total number of run-time checks done. This metric provides a rough estimate of how much of the checked code was proven free of run-time errors (more specifically, the run-time errors that were checked for).
You can see a further breakdown of run-time errors on the dashboard and open a subset of the results.
Select Run-time Checks on the toolstrip to open the Run-time Checks dashboard.
In the Details section of this dashboard, select View by File. In this example, there is only one file
example.c(if you opened the pre-analyzed project mentioned in the Example Files section, the fileexample.cis one of several files). Expand the node Static memory below this file.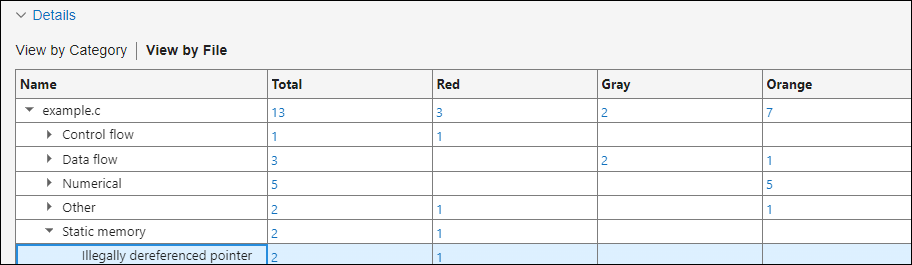
Click the hyperlinked number in the Red column for the check Illegally dereferenced pointer. This action opens the Review perspective containing one red Illegally dereferenced pointer result in the file
example.c.In the Review perspective, just below the toolstrip, you see that several filters are being applied to show a subset of results. The filters are:
Run-time Checks: Gray, Orange, Red, Static memory, Illegally dereferenced pointer
File: dataflow.c

For more information on the Dashboard perspective, see Dashboard in Polyspace Platform User Interface.
View Details of Results
In the Review perspective, you see a list of run-time errors or results on the Results List pane. You can select each result, investigate further details, then decide on a course of action, and finally implement the action. In this tutorial, you will mark a proven run-time error for fixing and mark a potential run-time error as not requiring an immediate fix.
Fix Code
First focus your review on red run-time errors. These are run-time errors that are proven to occur on all execution paths that were analyzed by Code Prover. To begin reviewing red run-time errors:
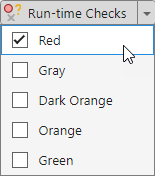
On the toolstrip, select the arrow beside Run-time Checks and clear all boxes except Red.
Select the Illegally dereferenced pointer result on the Results List pane. You see the following changes:
The Result Details pane shows additional information on the run-time error, including variable names and a list of events that leads to the error.
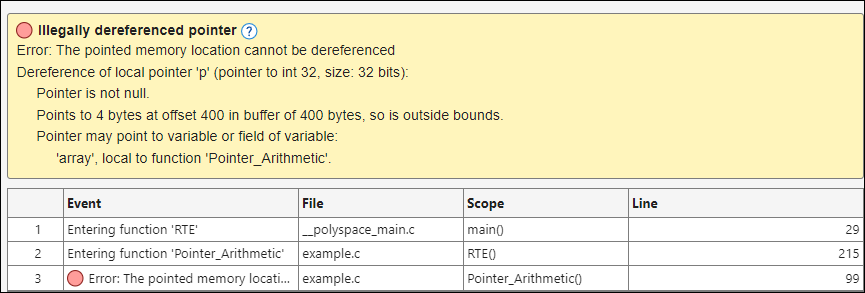
The Source Code pane shows the line in the code that causes the run-time error. In this case, the line highlighted is the following:
*p = 5;
The message on the Result Details pane states that the pointer
ppoints to a buffer of 400 bytes at an offset of 400 bytes from the beginning of the buffer. In other words, the pointer points to the end of the buffer. However, the pointerpitself allows reading or writing of 4 bytes of data (because its data type isint*withintallocated 4 bytes). Because these 4 bytes occur after the end of the buffer, dereferencing the pointer leads to a run-time error.To investigate the error further, on the Source Code pane, right-click the pointer
pand select Search For All References.Select the first reference in the search results on the Code Search pane. You can see that the pointer
pis defined at the beginning of the functionPointer_Arithmetic()and all subsequent uses ofpleading up to the error are in this function.You can continue to select items on the Code Search pane to navigate through the code. Note the following:
The pointer
ppoints to a 100-elementintarray.pis incremented in a 100-iterationforloop and therefore points to the end of the array by the time the loop ends.The execution then enters a couple of
ifstatements and finallypis dereferenced while still pointing to the end of the buffer. This dereference amounts to a pointer access out of bounds and is illegal according to the C standard.
Since dereferencing a pointer outside its allowed bounds is undefined behavior, you have to fix this issue. On the Result Details pane, set the Status of this result to To fix.
When you rerun analysis after fixing the source code, you can filter the results to ones with the To fix status. If there are no results after applying the filter, all the issues marked for fix have been actually fixed.
Justify Result or Constrain Analysis
Next, you will look at a type of potential run-time error flagged by Code Prover. When Code Prover analyzes code and attempts to prove the absence of run-time errors, it exhaustively covers all code execution paths that are possible in the current context. To determine this context, Code Prover uses both the source code and any additional information that you specified through the analysis configuration. If you have not constrained the analysis appropriately, some of the Code Prover assumptions might be broader than you expect. As a result, Code Prover might show potential run-time errors (orange) that are not possible in practice given your actual constraints.
To remove these potential run-time errors, you can constrain your analysis to accurately reflect any physical constraints that are not directly specified in your code. Applying the constraints can change some of the orange run-time errors to green. However, sometimes, a run-time error might be flagged because of mathematical approximations during static analysis and might remain orange despite constraining your analysis. In this case, you can assign an appropriate status to the result and include a justification for why you do not intend to fix the potential run-time error.
In the previous section, you looked at a proven Illegally dereferenced pointer result. In this section, you will look at an unproven Illegally dereferenced pointer result in the same function and explore both approaches: justifying results and constraining analysis.
Clear the filter that shows only red or proven run-time errors. Hover on the text Red in the filter string below the toolstrip and select Remove filter.

You can now see the results of all run-time checks for Illegally dereferenced pointer, including orange results (unproven run-time errors) and green results (proven absence of run-time error).
Select the orange Illegally dereferenced pointer result on the Results List pane (also indicated with a
 icon). Note the following changes:
The Source Code pane highlights the following line, with the pointer dereference highlighted in orange:
*(p - i) = 10;The Result Details pane shows the same message as the previous red Illegally dereferenced pointer result. However, in this case, the message indicates that even though the pointed size and the buffer size are known, the pointer offset is unknown. The pointer might be pointing to an offset of 0, 4, 8,…etc. up to the end of the buffer. Only if the pointer points to the end of the buffer is the pointer dereference illegal. Because the pointer dereference is not illegal on all execution paths, the run-time check returns orange (potential run-time error) instead of red (proven run-time error).
To understand why the pointer offset is unknown, follow these steps:
On the Source Code pane, hover on the variable
iin the line containing the error. You see thatican have any value from 0 to the upper limit of anintrange.Since
ican have a range of values, this message explains why the pointer(p - i)points to a range of offsets.To investigate why
ican have a range of values, you can follow one of several paths. For instance, you can search for all references ofisimilar to the approach in the previous section. In this example, however, you will use the information given on the Result Details pane showing the path that leads to the potential run-time error.Select the event:
On the Source Code pane, you see this line highlighted:Assignment to local variable 'i'Hover on the function name in the source code to see that the function is assumed to return all possiblei = get_bus_status();
intvalues, leading to a range of values ofi.Right-click the function
get_bus_status()in the above line and select Go To Definition. You see that instead of a definition, you navigate to the following line:This indicates that the functionextern int get_bus_status(void);
get_bus_status()is externally defined. In other words, its definition was not provided to the Code Prover analysis.
Suppose you know that
get_bus_status()is defined in another source file or library and returns a value greater than 1. You can provide the source code with the definition ofget_bus_status(), apply a constraint in the next analysis, or justify this result with an explanation.To justify the result, on the Result Details pane:
Set a Status of Justified to the result.
Add this Comment:
Requires additional Code Prover setup
In this example, you will continue with the result justified. Instead, if you want to constrain the analysis, select Project on the toolstrip to go to the Project perspective. Open your project configuration and locate the option Constraint setup. Create a constraint template file using the steps specified in the Constraint Specification window and specify a constraint of
1..maxon the return value ofget_bus_status().Clear the filters Static memory and Illegally dereferenced pointers. At this point, to familiarize yourself with Code Prover results review, continue reviewing results of other run-time checks. At any point, you can use appropriate filters to see the progress of your review.
To see all remaining unreviewed red, gray and orange run-time errors, in the Filters section of the toolstrip, select To do.
To see all results you marked for immediate fix, in the Filters section of the toolstrip, select In progress.
To see both unreviewed results and ones you marked for immediate fix, in the Filters section of the toolstrip, select Open.
To see the results you justified, in the Filters section of the toolstrip, select Done.
Alternatively, to see only the results you justified with a specific text, in the Show only text box at the top of the Results List pane, enter this text. For instance, you can enter
Requires additional Code Prover setupto see the result you justified in the previous step.
Note that the filters To do, In progress, Open and Done correspond to a set of review statuses (hover on a filter to see a tooltip with the filter definition). Instead of using these filters, you can also filter by specific review statuses such as To Fix or Justified. Expand the Filters section of the toolstrip to see all available filters.
See Also
Topics
- Interpret Polyspace Code Prover Results in Polyspace Platform User Interface
- Code Prover Result and Source Code Colors
- Variable Ranges in Source Code Tooltips After Code Prover Analysis
- Address Polyspace Results Through Bug Fixes or Justifications
- Filter and Sort Results in Polyspace Platform User Interface
- Polyspace Code Prover Results