Concurrency Modeling in Polyspace Desktop User Interface
The Concurrency Modeling view in the Polyspace® user interface shows the Polyspace modeling of your C/C++ application with respect to concurrent/multithreaded execution. On this view, you can see the following information extracted from your code and Polyspace configuration:
Tasks (entry point, cyclic task, interrupt, etc.): Each task indicates the beginning of a distinct program execution path that can be potentially interrupted by other tasks.
Resources (critical section, mutex, etc.): A resource is used to protect a section of code in a task from interruption by other tasks.
When investigating results that involve multiple tasks such as Potentially unprotected variable, you can use the information on this pane to understand the concurrency modeling of your application.
To open the Concurrency Modeling pane, first open your Polyspace analysis results in the user interface. On the Dashboard pane, click the Concurrency Modeling link.
Tasks
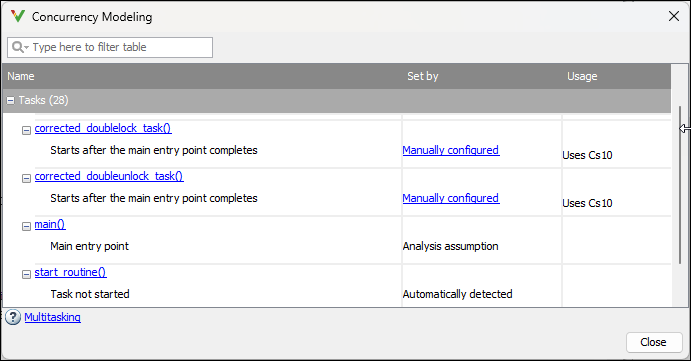
A snapshot of tasks on the Concurrency Modeling view looks like the following.

For each task, you see the following information in separate columns:
Name: Name of task. You can enter a string in the search box to focus on tasks containing that string in their name (and resources used by these tasks).
For automatically detected tasks such as ones created with
pthread_create(), this column shows the start routine of the task. For instance, if you invokepthread_create()as:This column shows the namepthread_create(&my_thread, NULL, start_routine, NULL);
start_routine().For tasks explicitly specified in the Polyspace configuration, this column shows the name you specified. For more information on how to specify tasks in the Polyspace analysis configuration, see Multitasking.
Set by: How Polyspace detects the task. The entry in this column can be one of the following:
Automatically detected: This entry indicates that the task was automatically detected from your code. For the full list of thread creation routines supported for automatic detection, see Auto-Detection of Thread Creation and Critical Section in Polyspace.
Manually configured: This entry indicates that the task was explicitly specified in your Polyspace analysis configuration. For more information, see Configuring Polyspace Multitasking Analysis Manually.
Analysis assumption: This entry indicates that the analysis has included the task in this list by default. Typically, this entry is used for the
main()function.
Usage: This column shows the resources used within a task. For instance, if a task
t1locks a mutex variablem1, this column shows the following entry for the row corresponding tot1:Uses m1
From this view, you can navigate to the following locations:
You can click a task name to go to its definition in the source code.
You can navigate to the line where the task begins. For instance, for a task created using
pthread_create(), you can navigate to the line wherepthread_create()is called.For tasks explicitly specified in the Polyspace configuration, you can click Manually configured in the Set by column to navigate to the configuration.
Resources
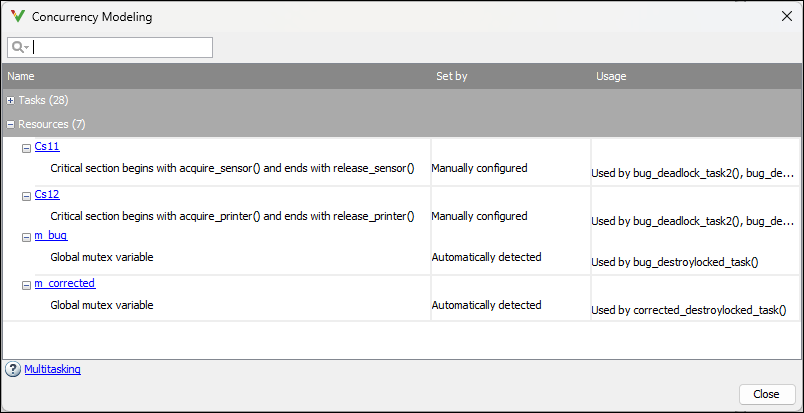
A snapshot of resources on the Concurrency Modeling view looks like the following.

For each task, you see the following information in separate columns:
Name: Name of resource. You can enter a string in the search box to focus on resources containing that string in their name (and tasks using these resources).
For automatically detected resources such as mutex variables used with
pthread_mutex_lock(), this column shows the name of the mutex variable. For instance, if you invokepthread_mutex_lock()as:This column shows the namepthread_mutex_lock(&mutex);
mutex.For resources such as critical section details explicitly specified in the Polyspace configuration, this column shows the name
Csfollowed by a number. The name is followed by the starting routine and end routine of the critical section. For more information on critical sections, seeCritical section details (-critical-section-begin -critical-section-end).
Set by: How Polyspace detects the resource. The entry in this column can be one of the following:
Automatically detected: This entry indicates that the resource was automatically detected from your code. For the full list of mutex lock/unlock routines supported for automatic detection, see Auto-Detection of Thread Creation and Critical Section in Polyspace.
Manually configured: This entry indicates that the resource was explicitly specified in your Polyspace analysis configuration. For more information, see Configuring Polyspace Multitasking Analysis Manually.
Usage: This column shows the tasks using the resource. For instance, if a task
t1locks a mutex variablem1, this column shows the following entry for the row corresponding tom1:Used by t1