Visualize Differences Between Floating-Point and Fixed-Point Results
R2026bThis example shows how to configure the codegen function to use a custom plot function to compare the behavior
of the generated fixed-point code against the behavior of the original floating-point
MATLAB® code.
By default, when the LogIOForComparisonPlotting option is enabled,
the conversion process uses a time series based plotting function to show the
floating-point and fixed-point results and the difference between them. However, during
fixed-point conversion you might want to visualize the numerical differences in a view
that is more suitable for your application domain. This example shows how to customize
plotting and produce scatter plots at the test numerics step of the fixed-point
conversion.
Copy Relevant Files
Copy the myFilter.m, myFilterTest.m, plotDiff.m, and filterData.mat files to a local working folder.
Prerequisites
To complete this example, you must install the following products:
MATLAB
MATLAB Coder™
Fixed-Point Designer™
C compiler
See Supported Compilers.
You can use
mex -setupto change the default compiler. See Change Default Compiler.
Inspect Example Files
| Type | Name | Description |
|---|---|---|
| Function code | myFilter.m | Entry-point MATLAB function |
| Test file | myFilterTest.m | MATLAB script that tests
myFilter.m |
| Plotting function | plotDiff.m | Custom plot function |
| MAT file | filterData.mat | Data to filter. |
Set Up Configuration Object
Create a
coder.FixptConfigobject.fxptcfg = coder.config('fixpt');Specify the test file name and custom plot function name. Enable logging and numerics testing.
fxptcfg.TestBenchName = 'myFilterTest';
fxptcfg.PlotFunction = 'plotDiff';
fxptcfg.TestNumerics = true;
fxptcfg.LogIOForComparisonPlotting = true;
fxptcfg.DefaultWordLength = 16;
Convert to Fixed Point
Convert the floating-point MATLAB function, myFilter, to fixed-point MATLAB code. You do not need to specify input types for the codegen command because it infers the
types from the test file.
codegen -args {complex(0, 0)} -float2fixed fxptcfg myFilter
The conversion process generates fixed-point code using a default word length of
16 and then runs a fixed-point simulation by running the
myFilterTest.m function and calling the fixed-point version
of myFilter.m.
Because you selected to log inputs and outputs for comparison plots and to use the
custom plotting function, plotDiff.m, for these plots, the
conversion process uses this function to generate the comparison plot.
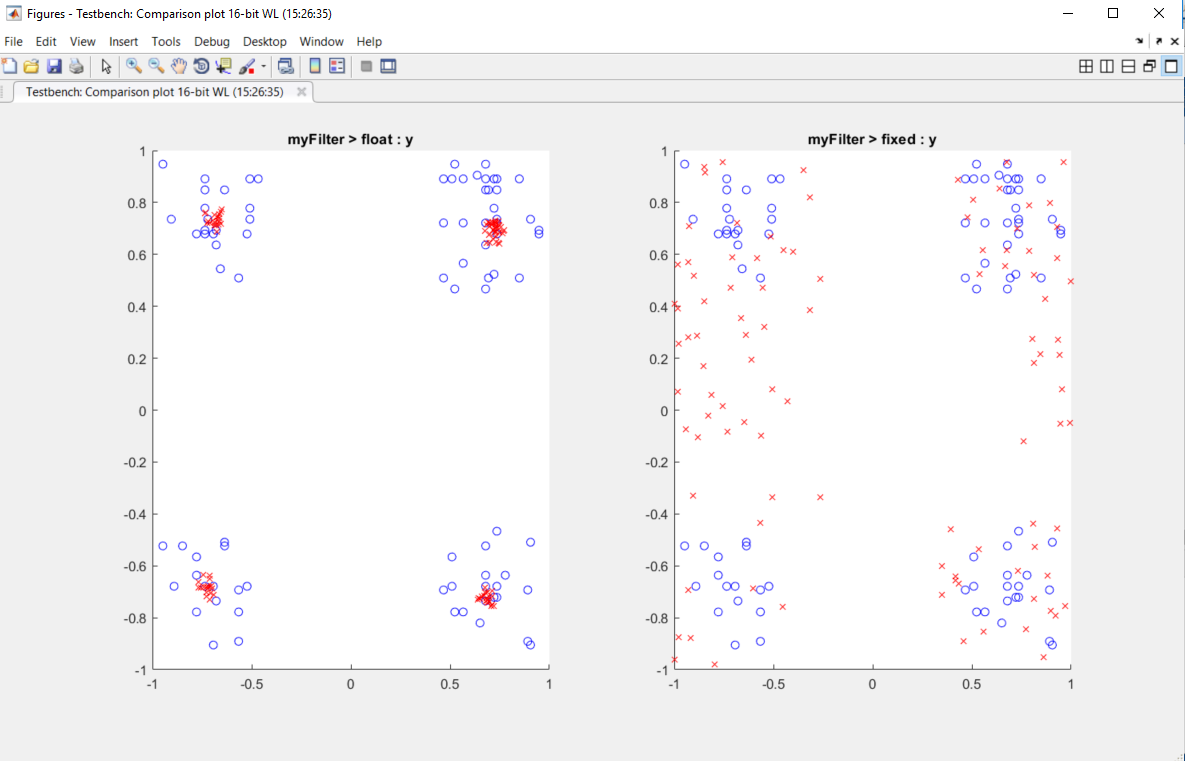
The plot shows that the fixed-point results do not closely match the floating-point results.
Increase the word length to 24 and then convert to fixed point
again.
fxptcfg.DefaultWordLength = 24;
codegen -args {complex(0, 0)} -float2fixed fxptcfg myFilter
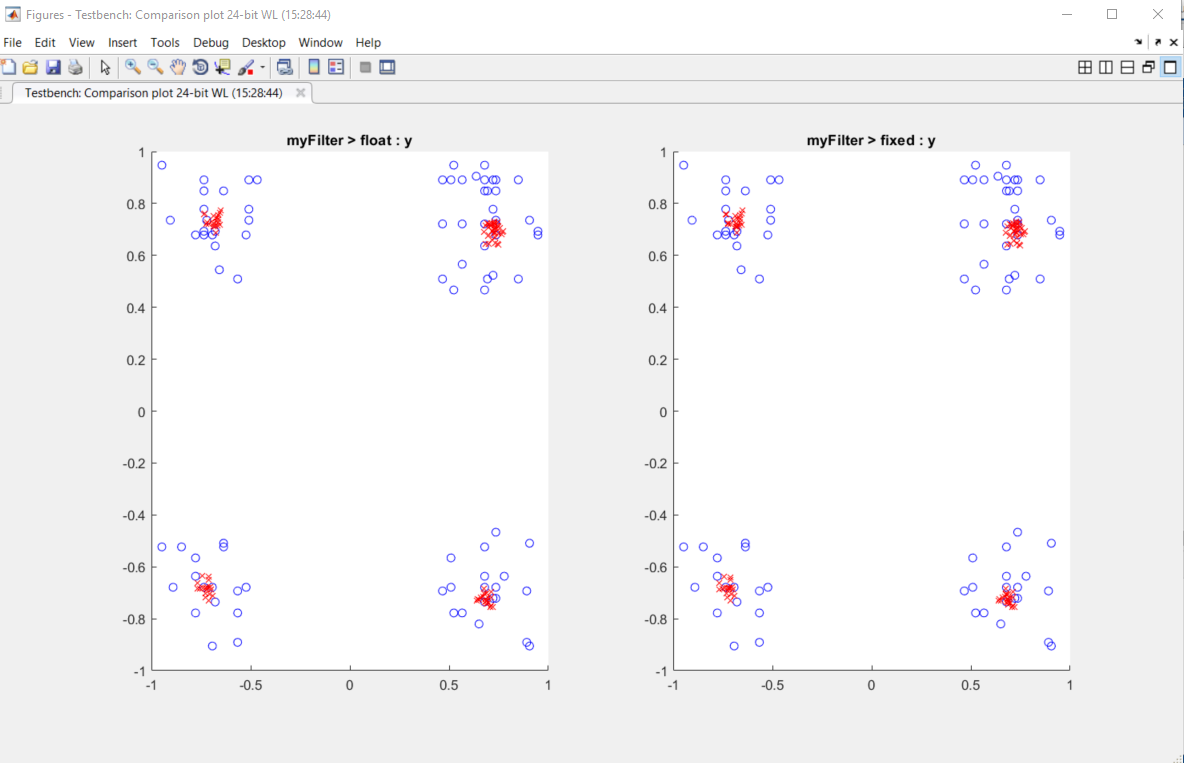
The increased word length improved the results. This time, the plot shows that the fixed-point results match the floating-point results.