Time-Domain Responses of Multiple Models
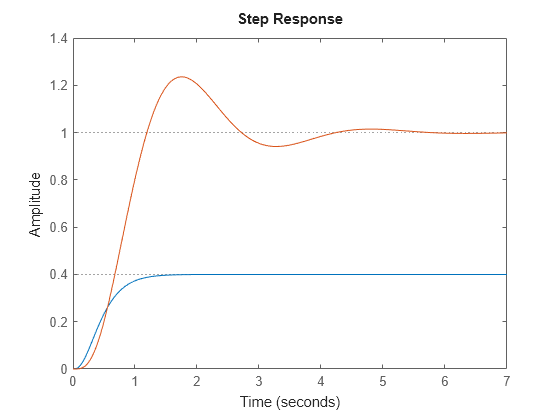
This example shows how to compare the step responses of multiple models on a single plot using step. This example compares the step response of an uncontrolled plant to the closed-loop step response of the plant with two different PI controllers. You can use similar techniques with other response commands, such as impulse or initial, to obtain plots of responses of multiple models.
For this example, obtain two models whose time responses you want to compare, and plot them on a single step plot. For instance, you can compare a third-order plant G, and the closed-loop response of G with a controller C1 having integral action.
G = zpk([],[-5 -5 -10],100);

C1 = pid(0,4.4);
CL1 = feedback(G*C1,1);

step(G,CL1);

When you provide multiple models to step as input arguments, the command displays the responses of both models on the same plot. If you do not specify a time range to plot, step attempts to choose a time range that illustrates the dynamics of all the models.
Compare the step response of the closed-loop model with another controller. Specify plot colors and styles for each response.
C2 = pid(2.9,7.1);
CL2 = feedback(G*C2,1);

step(G,'b--',CL1,'g-',CL2,'r-')

You can specify custom plot color and style for each response in the plot. For example, 'g-' specifies a solid green line for response CL2. For additional plot customization options, use stepplot.
See Also
step | initial | stepplot | initialplot | impulse | impulseplot | Linear System Analyzer