spectrumplot
Plot disturbance spectrum of linear identified models
Syntax
Description
spectrumplot( plots the disturbance
spectrum of the model, sys)sys. The software chooses the number of points
on the plot and the plot frequency range.
spectrumplot(sys1,line_spec1,...,sysN,line_specN) plots the
disturbance spectrum for one or more models on the same axes.
You can mix sys, line_spec pairs with
sys models as in
spectrumplot(sys1,sys2,line_spec2,sys3).
spectrumplot automatically chooses colors and line styles in the order
specified by the ColorOrder and LineStyleOrder
properties of the current axes.
spectrumplot( plots into
the axes with handle ax,___)ax. All input arguments described for the previous
syntaxes also apply here.
spectrumplot(___,
uses plot_options to specify options such as plot title, frequency units, etc. All input
arguments described for the previous syntaxes also apply here.plot_options)
Examples
Obtain the identified model.
load iddata9 z9
sys = ar(z9,4);
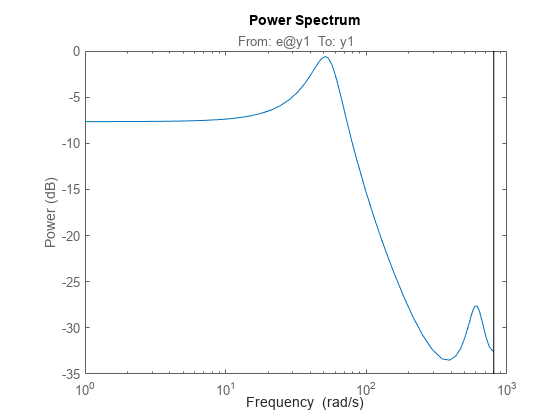
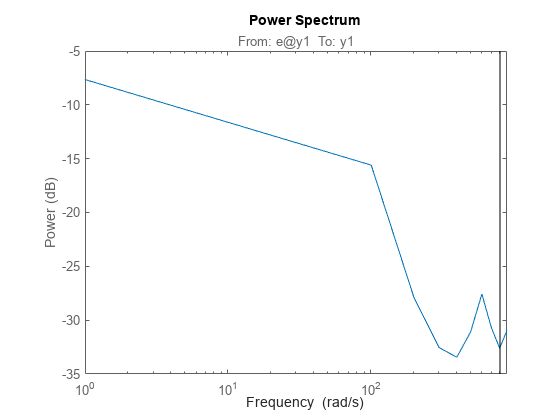
Plot the output spectrum for the model.
spectrumplot(sys);

Obtain the identified model.
load iddata9 z9
sys = ar(z9,4);
Specify the line width and marker style for the spectrum plot.
spectrumplot(sys,'k*--');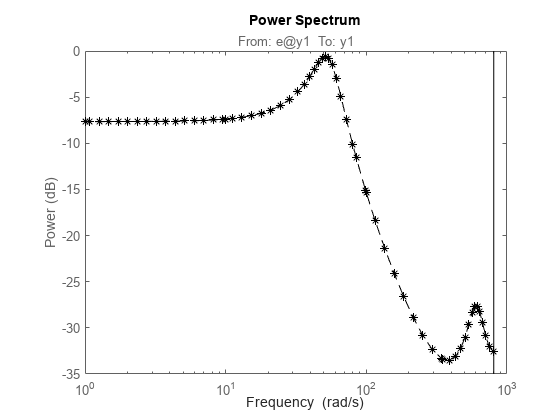
'k*--', specifies a dashed line (--) that is black (k), with star markers (*).
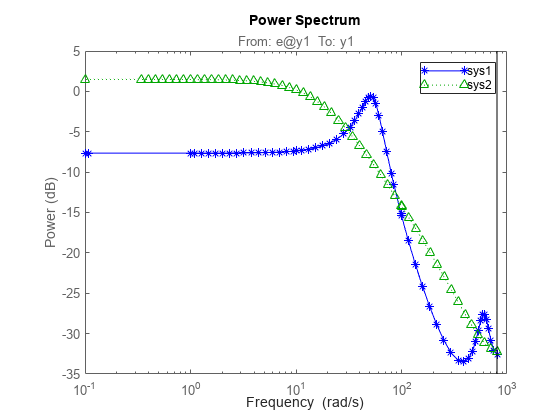
Obtain multiple identified models.
load iddata9 z9
sys1 = ar(z9,4);
sys2 = ar(z9,2);
Plot the output spectrum for both models.
spectrumplot(sys1,'b*-',sys2,'g^:');
legend('sys1','sys2');
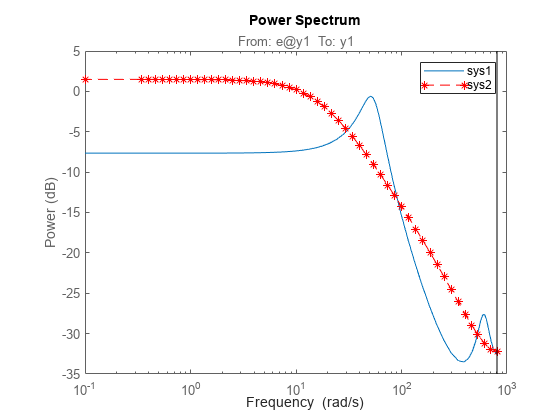
Obtain the axes handle for a plot.
load iddata9 z9
sys1 = ar(z9,4);
spectrumplot(sys1);
ax = gca;
ax is the handle for the spectrum plot axes.
Plot the output spectrum for another model on the specified axes.
sys2 = ar(z9,2);

hold on;
spectrumplot(ax,sys2,'r*--');

legend('sys1','sys2');
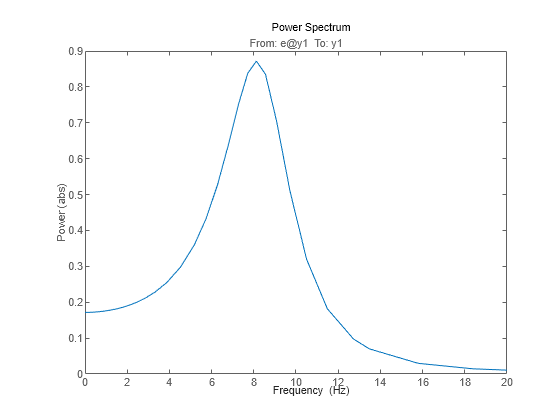
Specify the plot options.
plot_options = spectrumoptions;
plot_options.FreqUnits = 'Hz';
plot_options.FreqScale = 'linear';
plot_options.Xlim = {[0 20]};
plot_options.MagUnits = 'abs';
Estimate an AR model.
load iddata9 z9
sys = ar(z9,4);
Plot the output spectrum for the model.
spectrumplot(sys,plot_options);
Obtain the identified model.
load iddata9 z9
sys = ar(z9,4);
Specify the frequency range for the output spectrum plot for the model.
spectrumplot(sys,{1,1000});
The 2-element cell array {1,1000} specifies the frequency range from 1 rad/s to 1000 rad/s.
w = [1:100:1000];
spectrumplot(sys, w);
The numeric vector w specifies the frequency range from 1 rad/s to 1000 rad/s updating the plot every 100 data points.
Obtain the identified model.
load iddata9 z9
sys = ar(z9,4);
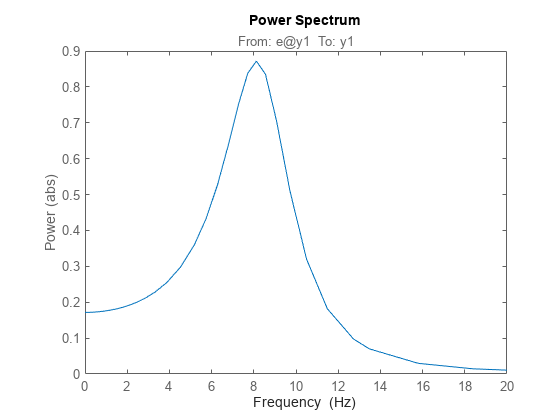
Get the plot handle for the model spectrum plot.
h = spectrumplot(sys);

(Optional) Specify the plot options, using the plot handle.
setoptions(h,'FreqUnits','Hz','FreqScale','linear','Xlim',{[0 20]},'MagUnits','abs');
Input Arguments
Output Arguments
Version History
Introduced in R2012b
See Also
spectrum | spectrumoptions | getoptions | setoptions | showConfidence | Axes Properties | Line Properties