Modify Graphics Objects
A MATLAB® chart consists of a hierarchy of graphics objects. A typical line plot consists
of the Root object (groot) followed by a Figure object, an
Axes object, and finally a Line object. You can access
objects in the hierarchy, view their properties, and change their appearance by setting
properties.
For a more comprehensive diagram of graphics objects, see Graphics Objects.
Access Objects
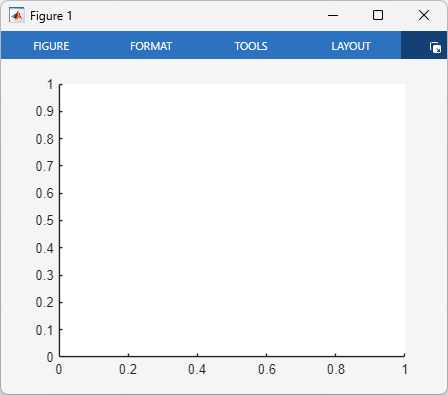
One way to access a graphics object is to return the object as an output argument when
you create it. For example, create a Figure object f
and a child Axes object ax.
f = figure;
ax = axes(f);
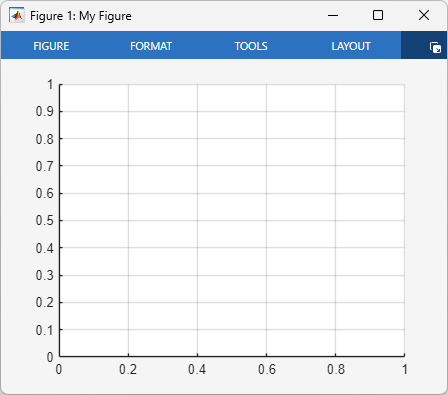
Use f and ax to set properties of the
Figure and Axes objects. For example, set the
Name property of the Figure object, and set the
XGrid and YGrid properties of the
Axes object to "on".
f.Name = "My Figure";
ax.XGrid = "on";
ax.YGrid = "on";
Another way to access different graphics objects is to use the gcf function to get the current figure, or use the gca function to get the current axes. The current figure is typically the
figure that you most recently created, clicked, or modified. If you call
gcf when no figures exist, MATLAB creates a Figure object and makes it the current figure.
Similarly, calling gca creates a new Axes object in
the current figure if the current figure is empty. If no figures exist,
gca creates a Figure object and places the
Axes object in it.
When you have access to the current Figure or Axes
object, you can use the Parent and Children properties
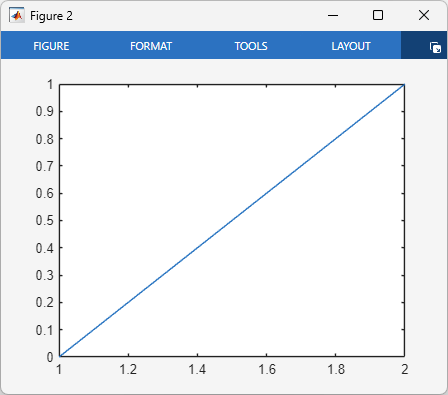
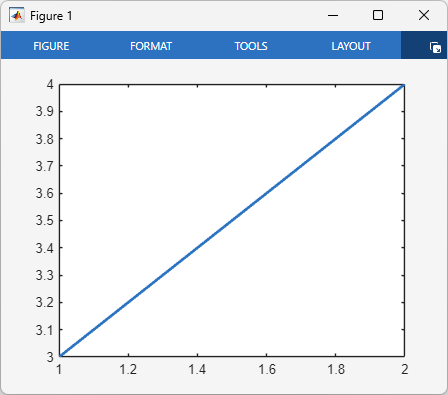
to access objects at different levels of the hierarchy. For example, create a new figure and
plot a line in it. In this case, the figure is initially empty, so the plot function creates
both an Axes object and a Line object.
figure
plot([0 1])
Use the gca function to get the current axes and store it in the
variable ax. Use the Parent and
Children properties of ax to get the
Figure and Line objects.
ax = gca;
f = ax.Parent;
p = ax.Children;
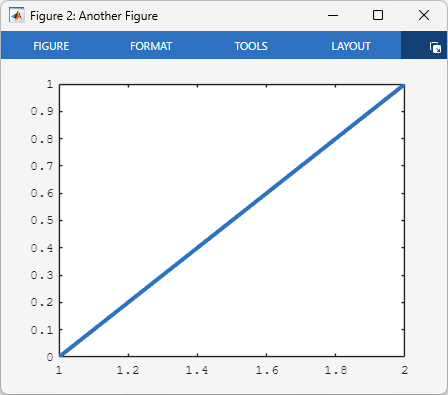
Change the figure name, axes font, and line width by setting properties.
f.Name = "Another Figure";
ax.FontName = "courier";
p.LineWidth = 3;
If an object has multiple children, you can use array indexing to select one or more child objects to modify. The index values are assigned in reverse creation order.
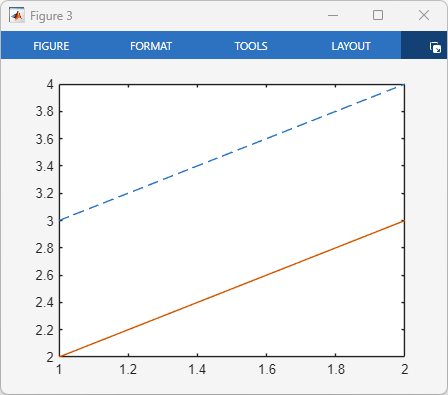
For example, plot two lines and assign a dashed line style to the first line you
created, which is the last array element in the Children property.
figure
plot([3 4])
hold on
plot([2 3])
hold off
ax = gca;
firstLine = ax.Children(end);
firstLine.LineStyle = "--";
View List of Properties
To view a list of properties of an object, use the get function. For example, create a figure and list its properties and their
values.
f = figure;
get(f)
Alphamap: [0 0.0159 0.0317 0.0476 0.0635 ...]
AutoResizeChildren: off
BeingDeleted: off
BusyAction: 'queue'
ButtonDownFcn: ''
Children: [0×0 GraphicsPlaceholder]
Clipping: on
CloseRequestFcn: 'closereq'
Color: [0.9608 0.9608 0.9608]
Colormap: [256×3 double]
ContextMenu: [0×0 GraphicsPlaceholder]
CreateFcn: ''
CurrentAxes: [0×0 GraphicsPlaceholder]
CurrentCharacter: ''
CurrentObject: [0×0 GraphicsPlaceholder]
CurrentPoint: [0 0]
DeleteFcn: ''
DockControls: on
FileName: ''
GraphicsSmoothing: on
HandleVisibility: 'on'
Icon: ''
InnerPosition: [363 278 1194 719]
IntegerHandle: on
Interruptible: on
InvertHardcopy: on
KeyPressFcn: ''
KeyReleaseFcn: ''
MenuBar: 'none'
Name: ''
NextPlot: 'add'
Number: 1
NumberTitle: on
OuterPosition: [363 278 1194 719]
PaperOrientation: 'portrait'
PaperPosition: [-1.9688 1.7552 12.4375 7.4896]
PaperPositionMode: 'auto'
PaperSize: [8.5000 11]
PaperType: 'usletter'
PaperUnits: 'inches'
Parent: [1×1 Root]
Pointer: 'arrow'
PointerShapeCData: [16×16 double]
PointerShapeHotSpot: [1 1]
Position: [363 278 1194 719]
Renderer: 'opengl'
RendererMode: 'auto'
Resize: on
Scrollable: off
SelectionType: 'normal'
SizeChangedFcn: ''
Tag: ''
Theme: [1×1 matlab.graphics.theme.GraphicsTheme]
ThemeChangedFcn: ''
ThemeMode: 'auto'
ToolBar: 'auto'
Type: 'figure'
Units: 'pixels'
UserData: []
Visible: on
WindowButtonDownFcn: ''
WindowButtonMotionFcn: ''
WindowButtonUpFcn: ''
WindowKeyPressFcn: ''
WindowKeyReleaseFcn: ''
WindowScrollWheelFcn: ''
WindowState: 'normal'
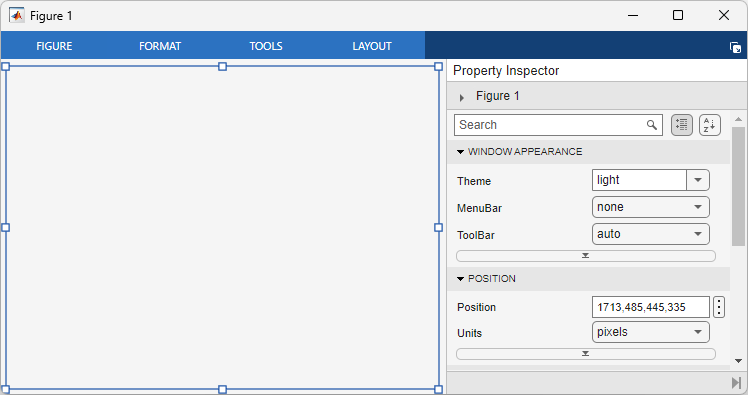
WindowStyle: 'docked'You can also view the properties in an interactive property inspector using the
inspect function.
inspect(f)
For detailed descriptions of all graphics object properties, see Graphics Object Properties.
Set Properties
There are several ways to set properties of graphics objects. Choose a method that is most convenient for you.
Use Dot Notation
As demonstrated in the preceding examples, you can use dot notation if you have access
to an existing object. With dot notation, you specify the object variable name followed by
a period and the property name. For example, this code plots a line and sets the line
width to 2.
figure
p = plot([3 4]);
p.LineWidth = 2;
Use Name-Value Arguments
You can also set properties by specifying name-value arguments when you call a plotting function. To specify a name-value argument, use a property name followed by an equal sign and a property value. Specify one or more name-value arguments after all other arguments.
For example, set the LineStyle and LineWidth
properties when you plot a line.
figure
plot([3 4],LineStyle="--",LineWidth=2)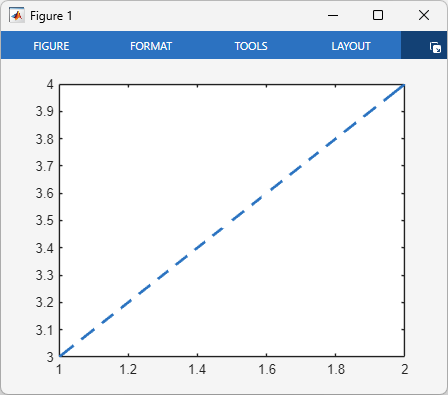
Note
You can also specify name-value arguments when you create an Axes
object. However, most plotting functions reset the axes properties. For best results,
set axes properties after plotting.
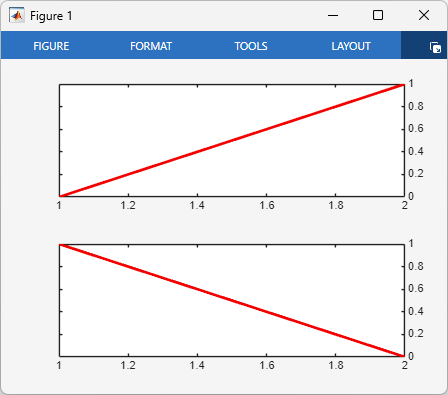
Use set Function
To set a property on multiple objects at once, use the set
function. For example, plot two lines in a tiled chart layout. Modify the lines so that
they both have a width of 2 and a red color. Then set the location of
both y-axes to the right side.
figure
ax1 = nexttile;
p1 = plot([0 1]);
ax2 = nexttile;
p2 = plot([1 0]);

% Set the width and color of both lines
set([p1 p2],LineWidth=2,Color="red")

% Display the y-axes on the right side
set([ax1 ax2],YAxisLocation="right")
Use Functions That Control Specific Properties
As an alternative to setting properties directly, you can use functions to set certain properties.
For example, plot a line and then show the axes grid lines, change the font, and
adjust the x- and y-axes limits. The grid function changes the XGrid and
YGrid properties of the Axes object. The fontname
function changes the FontName property of the Axes
object. The xlim and ylim functions change the XLim and
YLim properties of the Axes object.
figure
plot([0 4 2 6 4 8],Marker="o")
grid on
fontname("courier")
xlim([0 7])
ylim([-1 9])
![Figure containing an axes object that displays grid lines and contains a line plot with x-axis limits of [0, 7] and y-axis limits of [–1, 9]. The tick labels use the Courier font.](modify-gobjects-axeslims.png)
For a list of functions that set Axes properties, see Axes Appearance.