Plotting Data
Introduction
After you import data into the MATLAB® workspace, it is a good idea to plot the data so that you can explore its features. An exploratory plot of your data enables you to identify discontinuities and potential outliers, as well as the regions of interest.
The MATLAB figure window displays plots. See Types of MATLAB Plots for a full description of the figure window. It also discusses the various interactive tools available for editing and customizing MATLAB graphics.
Load and Plot Data from Text File
This example uses sample data in count.dat, a space-delimited text file. The file consists of three sets of hourly traffic counts, recorded at three different town intersections over a 24-hour period. Each data column in the file represents data for one intersection.
Load the count.dat Data
Import data into the workspace using the load function.
load count.datLoading this data creates a 24-by-3 matrix called count in the MATLAB workspace.
Get the size of the data matrix.
[n,p] = size(count)
n =
24
p =
3
n represents the number of rows, and p represents the number of columns.
Plot the count.dat Data
Create a time vector, t, containing integers from 1 to n.
t = 1:n;
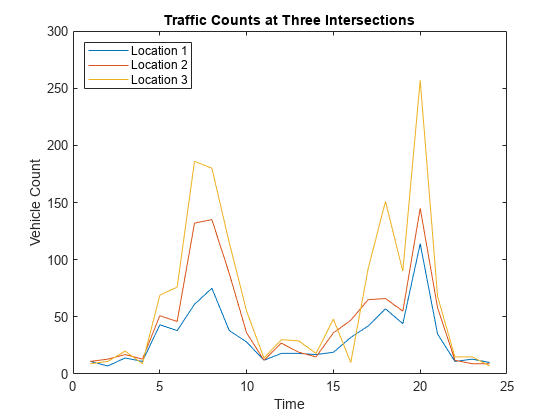
Plot the data as a function of time, and annotate the plot.
plot(t,count),
legend('Location 1','Location 2','Location 3','Location','NorthWest')
xlabel('Time'), ylabel('Vehicle Count')
title('Traffic Counts at Three Intersections')
See Also
load | plot | legend | xlabel | ylabel | title | size