matlab.graphics.chartcontainer.mixin.Legend Class
Namespace: matlab.graphics.chartcontainer.mixin
Add legend support to chart container subclass
Description
matlab.graphics.chartcontainer.mixin.Legend is a class for adding legend
support to charts that inherit from matlab.graphics.chartcontainer.ChartContainer. By inheriting from this class, you
can display a legend in your chart. Your users can select options in the figure menu bar or
the figure toolbar to show or hide that legend.
Use this syntax to enable legend support for your chart:
classdef MyChart < matlab.graphics.chartcontainer.ChartContainer & ...
                   matlab.graphics.chartcontainer.mixin.Legend
  ...
end
The matlab.graphics.chartcontainer.mixin.Legend class is a handle class.
Class Attributes
Abstract | true |
HandleCompatible | true |
For information on class attributes, see Class Attributes.
Properties
Methods
Examples
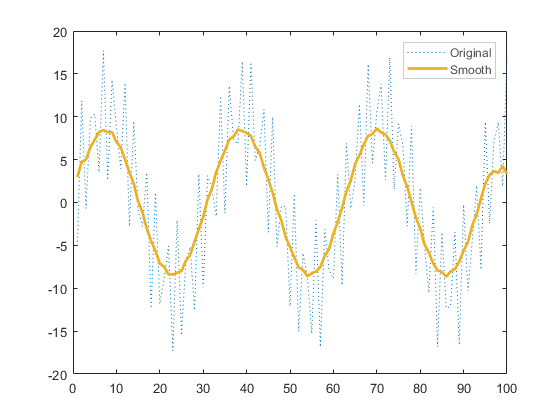
Define a SmoothLegendPlot class that plots a set of data using a dotted blue line with a smoothed version of the line.
To define the class, create a file named SmoothLegendPlot.m that contains the following code. The setup method for this class performs these tasks:
Creates two
Lineobjects with the appropriateDisplayNamevalues to show in the legendMakes the legend visible by setting the
LegendVisibleproperty to'on'Gets the
Legendobject and customizes the text color, box edge color, and box line width
classdef SmoothLegendPlot < matlab.graphics.chartcontainer.ChartContainer & ...
        matlab.graphics.chartcontainer.mixin.Legend

    properties
        XData (1,:) double = NaN
        YData (1,:) double = NaN
        SmoothColor (1,3) double {mustBeGreaterThanOrEqual(SmoothColor,0),...
            mustBeLessThanOrEqual(SmoothColor,1)} = [0.9290 0.6940 0.1250]
        SmoothWidth (1,1) double = 2
    end
    properties(Access = private,Transient,NonCopyable)
        OriginalLine (1,1) matlab.graphics.chart.primitive.Line
        SmoothLine (1,1) matlab.graphics.chart.primitive.Line
    end

    methods(Access = protected)
        function setup(obj)
            ax = getAxes(obj);

            % Create line objects. Define line styles and legend names.
            obj.OriginalLine = plot(ax,NaN,NaN,'LineStyle',':',...
                'DisplayName','Original');
            hold(ax,'on')
            obj.SmoothLine = plot(ax,NaN,NaN,...
                'DisplayName','Smooth');

            % Make legend visible
            obj.LegendVisible = 'on';

            % Get legend and set text color, edge color, and line width
            lgd = getLegend(obj);
            lgd.TextColor = [.3 .3 .3];
            lgd.EdgeColor = [.8 .8 .8];
            lgd.LineWidth = .7;
            hold(ax,'off')
        end
        function update(obj)
            % Update Line data
            obj.OriginalLine.XData = obj.XData;
            obj.OriginalLine.YData = obj.YData;
            obj.SmoothLine.XData = obj.XData;
            obj.SmoothLine.YData = createSmoothData(obj);

            % Adjust smooth line appearance
            obj.SmoothLine.LineWidth = obj.SmoothWidth;
            obj.SmoothLine.Color = obj.SmoothColor;
        end
        function sm = createSmoothData(obj)
            % Calculate smoothed data
            v = ones(1,10)*0.1;
            sm = conv(obj.YData,v,'same');
        end
    end
end
Next, create a pair of x and y vectors. Plot x and y by calling the SmoothLegendPlot constructor method, which is inherited from the ChartContainer class. Specify the 'XData' and 'YData' name-value pair arguments and return the chart object as c.
x = 1:1:100;
y = 10*sin(x./5)+8*sin(10.*x+0.5);
c = SmoothLegendPlot('XData',x,'YData',y);
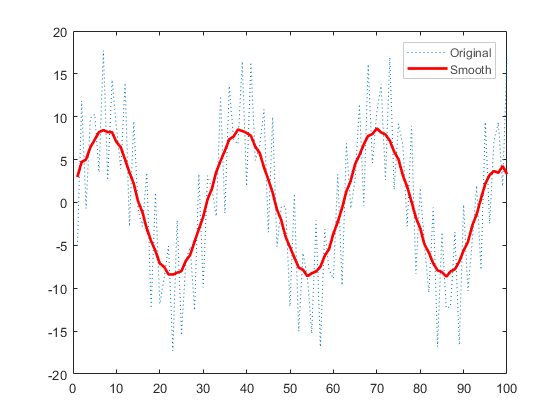
Use c to change the color of the smooth line to red. Notice that the legend also shows the new line color.
c.SmoothColor = [1 0 0];
Version History
Introduced in R2019b