show
Description
Examples
Create an occupancy map from an example map.
load("exampleMaps.mat","simpleMap");
map = occupancyMap(simpleMap);
Create a state validator with stateSpaceSE2 using the map.
sv = validatorOccupancyMap(stateSpaceSE2,Map=map);
Specify the start and goal states.
start = [5 8 pi/2];
goal = [7 18 pi/2];
Create a plannerBenchmark object.
pbo = plannerBenchmark(sv,start,goal);
Define the function handles for the initialization functions of the planners.
plannerHAFcn = @(sv)plannerHybridAStar(sv);
plannerRRTSFcn = @(sv)plannerRRTStar(sv.StateSpace,sv);
Define the function handle for the plan function, which is common for both planners.
plnFcn = @(initOut,s,g)plan(initOut,s,g);
Add the path planners for benchmarking.
addPlanner(pbo,plnFcn,plannerHAFcn);
addPlanner(pbo,plnFcn,plannerRRTSFcn,PlannerName="ppRRTStar");
Set the rng for repetitive results.
rng('default')Run the path planners for the number of times specified in runCount to collect metrics.
runCount = 5;
runPlanner(pbo,runCount)
Initializing plannerHAFcn_plnFcn ...
Done.
Planning a path from the start pose (5 8 1.5708) to the goal pose (7 18 1.5708) using plannerHAFcn_plnFcn.
Executing run 1.
Executing run 2.
Executing run 3.
Executing run 4.
Executing run 5.
Initializing ppRRTStar ...
Done.
Planning a path from the start pose (5 8 1.5708) to the goal pose (7 18 1.5708) using ppRRTStar.
Executing run 1.
Executing run 2.
Executing run 3.
Executing run 4.
Executing run 5.
Access path length metric for all the runs on the environment.
[pLenSummary,pLenData] = metric(pbo,"pathLength")pLenSummary=2×4 table
Mean Median StdDev sampleSize
______ ______ _______ __________
plannerHAFcn_plnFcn 10.204 10.204 0 5
ppRRTStar 12.84 12.9 0.67112 5
pLenData=2×5 table
                            Run1      Run2      Run3      Run4      Run5
                           ______    ______    ______    ______    ______

    plannerHAFcn_plnFcn    10.204    10.204    10.204    10.204    10.204
    ppRRTStar                13.8      12.9      12.2        12      13.3
Visualize all the metrics.
show(pbo)
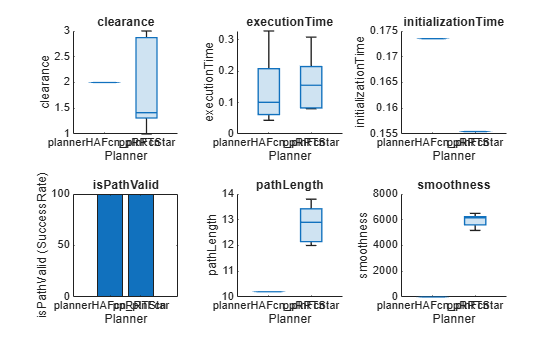
Closely inspect the clearance metric.
figure
show(pbo,"clearance")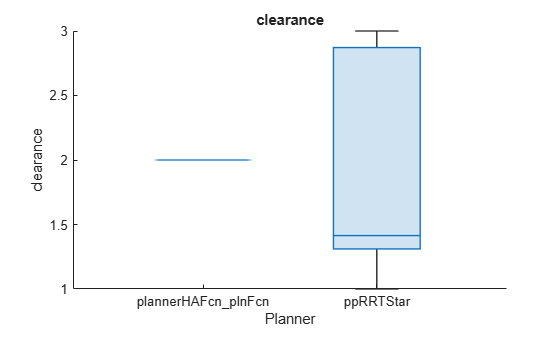
Input Arguments
Output Arguments
Version History
Introduced in R2022a