Multi-Constellation GNSS Positioning Using RINEX Files
This example shows how to use RINEX observation data and navigation data files from multiple satellite systems to estimate the position of a GPS or GNSS receiver. By using signals from multiple constellations, you can improve the accuracy and reliability of positioning in environments where buildings or other obstacles obstruct satellite visibility.
The data in these RINEX files were collected from a GNSS receiver mounted on a vehicle driving through Nagoya, Japan. The data contains measurements from the GPS, Galileo, GLONASS, BeiDou, and QZSS satellite systems. The corresponding MAT file spsRINEXLLA.mat contains the ground truth geodetic positions of the vehicle.
Load Satellite Data
Specify the observation and navigation data RINEX files, as well as the ground truth geodetic position MAT file.
obsfile ="spsRINEXOBS.obs"; navfile =
"spsRINEXNAV.nav"; groundtruthfile =
"spsRINEXLLA.mat";
Load the observation and navigation data using the rinexread function.
[obsdata,obshdr] = rinexread(obsfile);
[navmsg,nsvhdr] = rinexread(navfile);
Specify Satellite System Parameters
Set the signal strength threshold to 30 dBHz to exclude weak signals that might be affected by noise or multipath.
cn0Threshold = 30; % dBHzSelect the satellite systems to use in the position estimation. Using more satellite systems can improve positioning accuracy and reliability, but might increase computation time.
useGPS =true; useGalileo =
true; useGLONASS =
true; useBeiDou =
true; useQZSS =
true;
Process Raw GNSS Measurements
Create an exampleHelperGNSSMultiConstellation helper object to use for multi-constellation processing and visualization. Then, get a list of all the satellite systems in the observation data.
helpergnssinfo = exampleHelperGNSSMultiConstellation(useGPS,useGalileo,useGLONASS,useBeiDou,useQZSS);
allsatsys = helperSatelliteSystemList(helpergnssinfo,obsdata);
For each satellite system, compute the satellite positions using the gnssmeasurements function. Exclude observation data that does not have corresponding navigation data or a signal strength greater than the signal strength threshold cn0Threshold.
meas = timetable;
for ii = 1:numel(allsatsys)
    % Get observation and navigation data for the current satellite system,
    % with the corresponding pseudorange and signal strength
    satsys = allsatsys{ii};
    currobs = obsdata.(satsys);
    currnav = navmsg.(satsys);
    prcode = helpergnssinfo.SatelliteSystemInfo(satsys).PseudorangeCode;
    snrcode = helpergnssinfo.SatelliteSystemInfo(satsys).SNRCode;

    % Remove observations from satellites that do not have
    % corresponding navigation data.
    obssatid = currobs.SatelliteID;
    navsatid = unique(currnav.SatelliteID);
    hasnavmsg = ismember(obssatid,navsatid);
    currobs(~hasnavmsg,:) = [];

    % Remove observations with low signal strength.
    lowCN0 = currobs.(snrcode) < cn0Threshold;
    currobs(lowCN0,:) = [];

    % Store filtered observation information for visualization
    helperStoreObservationInfo(helpergnssinfo,satsys,currobs);

    % Compute GNSS measurements for the current satellite system and append
    % to measurement timetable
    currmeas = gnssmeasurements(currobs,currnav,prcode);
    meas = [meas; currmeas]; %#ok<AGROW>
end
Sort all the measurements by reception time.
meas = helperSort(helpergnssinfo,meas);
Estimate and Visualize Receiver Position
Estimate geodetic position of the receiver with single point positioning using the receiverposition function.
lla = receiverposition(meas);
Load the ground truth MAT file for use in calculating the position estimation error.
load(groundtruthfile,"groundTruthLLA");
numSamples = size(groundTruthLLA,1);
Select a time index of a position estimate to view the corresponding satellite positions and signal strengths.
Visualize the GNSS positioning results for the time index 3900. This time index corresponds to a position estimate with a large amount of error.
timeidx = 3900;
helperPlot(helpergnssinfo,timeidx,meas,lla,groundTruthLLA);
3900;
helperPlot(helpergnssinfo,timeidx,meas,lla,groundTruthLLA);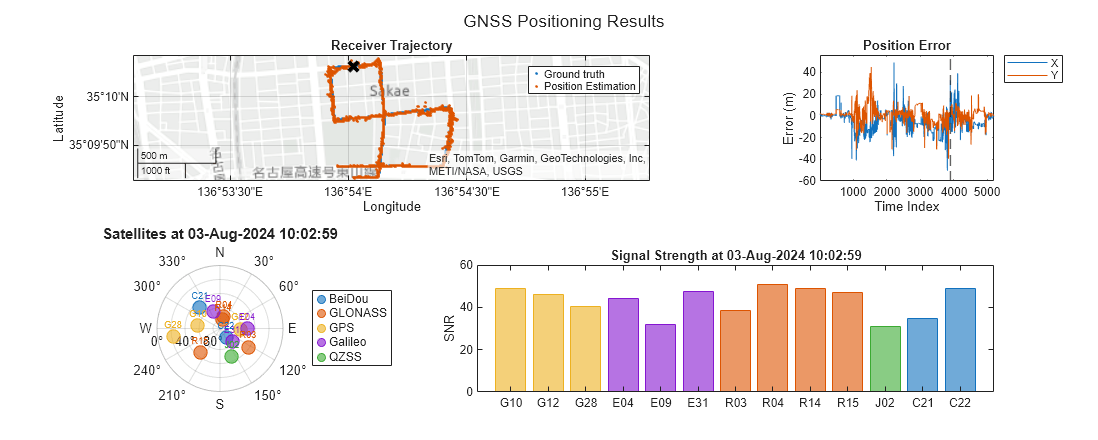
Visualize the GNSS positioning results for the time index 800. This time index corresponds to a position estimate with a small amount of error. Note that more satellites are available to use to estimate the position at this time index compared to the previous time index, resulting in an estimated position with less error.
timeidx = 800;
helperPlot(helpergnssinfo,timeidx,meas,lla,groundTruthLLA);
800;
helperPlot(helpergnssinfo,timeidx,meas,lla,groundTruthLLA);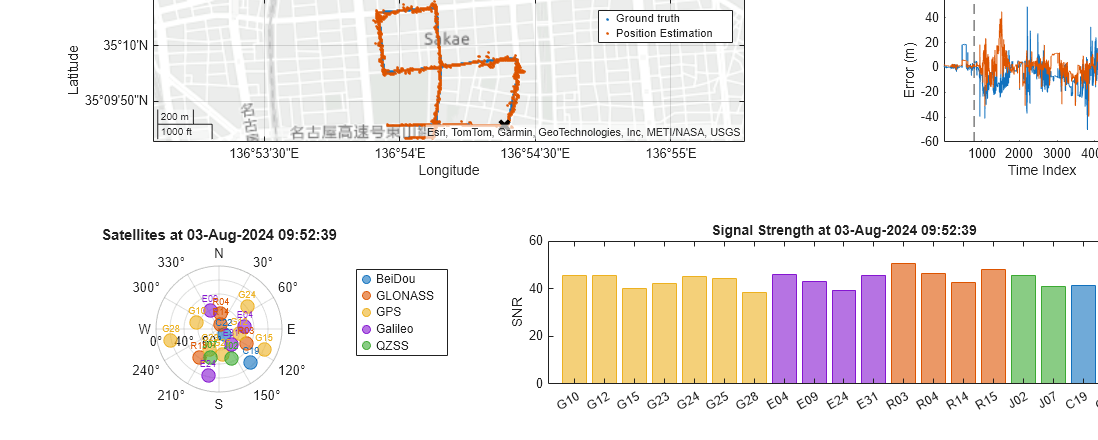
See Also
rinexread | gnssmeasurements | receiverposition