2-D Geometry Creation in PDE Modeler App
Create Basic Shapes
The PDE Modeler app lets you draw four basic shapes: a circle, an ellipse, a rectangle, and a polygon. To draw a basic shape, use the Draw menu or one of the following buttons on the toolbar. To cut, clear, copy, and paste the solid objects, use the Edit menu.
| Draw a rectangle/square starting at a corner. Using the left mouse button, drag to create a rectangle. Using the right mouse button (or Ctrl+click), drag to create a square. |
| Draw a rectangle/square starting at the center. Using the left mouse button, drag to create a rectangle. Using the right mouse button (or Ctrl+click), drag to create a square. |
| Draw an ellipse/circle starting at the perimeter. Using the left mouse button, drag to create an ellipse. Using the right mouse button (or Ctrl+click), drag to create a circle. |
| Draw an ellipse/circle starting at the center. Using the left mouse button, drag to create an ellipse. Using the right mouse button (or Ctrl+click), drag to create a circle. |
| Draw a polygon. Using the left mouse button, drag to create polygon edges. You can close the polygon by pressing the right mouse button. Clicking at the starting vertex also closes the polygon. |
Alternatively, you can create a basic shape by typing one of the following commands in the MATLAB® Command Window:
These commands open the PDE Modeler app with the requested shape already drawn in it. If the app is already open, these commands add the requested shape to the app window without deleting any existing shapes.
You can use a sequence of drawing commands to create several basic shapes. For example, these commands create a circle, a rectangle, an ellipse, and a polygon:
pderect([-1.5,0,-1,0])
pdecirc(0,0,1)
pdepoly([-1,0,0,1,1,-1],[0,0,1,1,-1,-1])
pdeellip(0,0,1,0.3,pi)
Select Several Shapes
To select a single shape, click it using the left mouse button.
To select several shapes and to deselect shapes, use Shift+click (or click using the middle mouse button). Clicking outside of all shapes, deselects all shapes.
To select all the intersecting shapes, click the intersection of these shapes.
To select all shapes, use the Select All option from the Edit menu.
Rotate Shapes
To rotate a shape:
Select the shapes.
Select Rotate from the Draw menu.
In the resulting Rotate dialog box, enter the rotation angle in degrees. To rotate counterclockwise, use positive values of rotation angles. To rotate clockwise, use negative values.
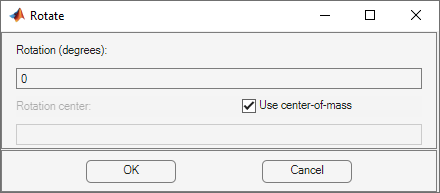
By default, the rotation center is the center-of-mass of the selected shapes. To use a different rotation center, clear the Use center-of-mass option and enter a rotation center (xc,yc) as a 1-by-2 vector, for example,
[-0.4 0.3].
Create Complex Geometries
You can specify complex geometries by overlapping basic shapes. This approach is called Constructive Solid Geometry (CSG). The PDE Modeler app lets you combine basic shapes by using their unique names.
The app assigns a unique name to each shape. The names depend on the type of the shape:
For circles, the default names are
C1,C2,C3, and so on.For ellipses, the default names are
E1,E2,E3, and so on.For polygons, the default names are
P1,P2,P3, and so on.For rectangles, the default names are
R1,R2,R3, and so on.For squares, the default names are
SQ1,SQ2,SQ3, and so on.
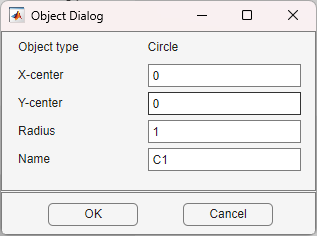
To change the name and parameters of a shape, first switch to the draw mode and then double-click the shape. (Select Draw Mode from the Draw menu to switch to the draw mode.) The resulting dialog box lets you change the name and parameters of the selected shape. The name cannot contain spaces.
Now you can combine basic shapes to create a complex geometry. To do this, use the Set formula field located under the toolbar. Here you can specify a geometry by using the names of basic shapes and the following operators:
+is the set union operator.For example,
SQ1+C2creates a geometry comprised of all points of the squareSQ1and all points of the circleC2.*is the set intersection operator.For example,
SQ1*C2creates a geometry comprised of the points that belong to both the squareSQ1and the circleC2.-is the set difference operator.For example,
SQ1-C2creates a geometry comprised of the points of the squareSQ1that do not belong to the circleC2.
The operators + and * have the same precedence.
The operator - has a higher precedence. You can control the
precedence by using parentheses. The resulting geometrical model (called
decomposed geometry) is the set of points for which the set
formula evaluates to true. By default, it is the union of all basic shapes.
Adjust Axes Limits and Grid
To adjust axes limits:
Select Axes Limits from the Options menu
Specify the range of the x-axis and the y-axis as a 1-by-2 vector such as
[-10
                        10]
. If you select Auto, the app uses automatic scaling for the corresponding axis.![Dialog box for specifying axes limits. The X-axis range is specified as [-1.5 1.5], the Y-axis range is specified as [-1 1]. The Auto checkboxes for both axes are not selected.](axes_limits.png)
Apply the specified axes ranges by clicking Apply.
Close the dialog box by clicking Close.
To add axis grid, the snap-to-grid feature, and zoom, use the Options menu. To adjust the grid spacing:
Select Grid Spacing from the Options menu.
By default, the app uses automatic linear grid spacing. To enable editing the fields for linear spacing and extra ticks, clear Auto.
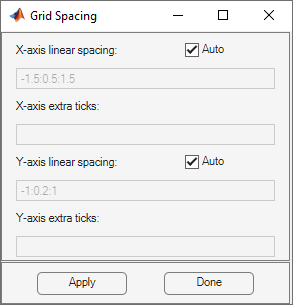
Specify the grid spacing for the x-axis and y-axis. For example, change the linear spacing for the x-axis to
-1.5:0.2:1.5.You also can add extra ticks to customize the grid and aid in drawing. To separate extra tick entries, use spaces, commas, semicolons, or brackets.
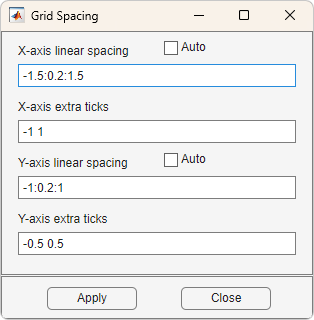
Apply the specified grid spacing by clicking Apply.
Close the dialog box by clicking Done.
Create Geometry with Rounded Corners
Open the PDE Modeler app by using the
pdeModelercommand.Display grid lines by selecting Options > Grid.
Align new shapes to the grid lines by selecting Options > Snap.
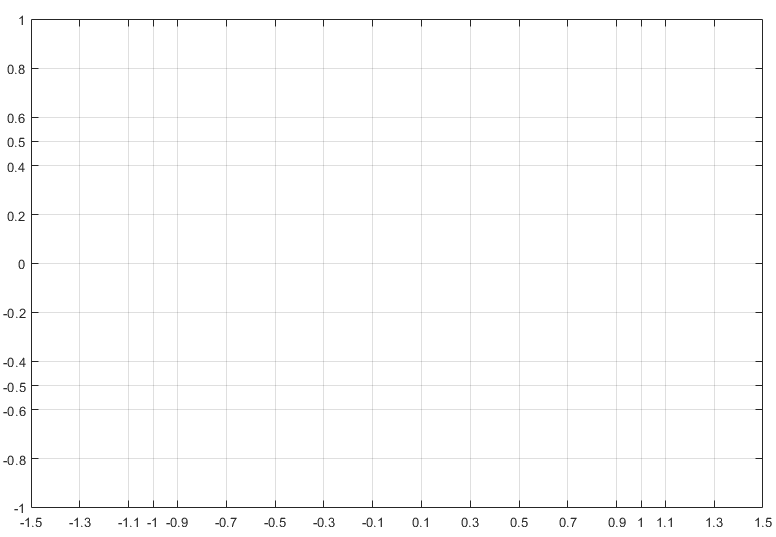
Set the grid spacing for x-axis to
-1.5:0.1:1.5and for y-axis to-1:0.1:1. To do this, select Options > Grid Spacing, clear the Auto checkboxes, and set the corresponding ranges.Draw a rectangle with the width 2, the height 1, and the top left corner at (–1,0.5). To do this, first click the
 button. Then click the point (–1,0.5) and drag to draw a
rectangle.
button. Then click the point (–1,0.5) and drag to draw a
rectangle.To edit the parameters of the rectangle, double-click it. In the resulting dialog box, specify the exact parameters.
Draw four circles with the radius 0.2 and the centers at (–0.8,–0.3), (–0.8,0.3), (0.8,–0.3), and (0.8,0.3).To do this, first click the
 button. Then click the center of a circle using the right
mouse button and drag to draw a circle. The right mouse button constrains the
shape you draw to be a circle rather than an ellipse. If the circle is not a
perfect unit circle, then double-click it. In the resulting dialog box, specify
the exact center location and radius of the circle.
button. Then click the center of a circle using the right
mouse button and drag to draw a circle. The right mouse button constrains the
shape you draw to be a circle rather than an ellipse. If the circle is not a
perfect unit circle, then double-click it. In the resulting dialog box, specify
the exact center location and radius of the circle.Add four squares with the side 0.2, one in each corner.
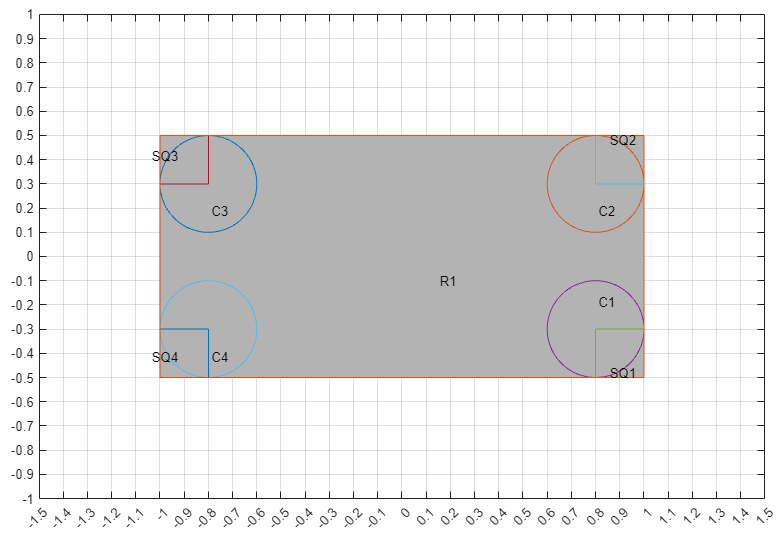
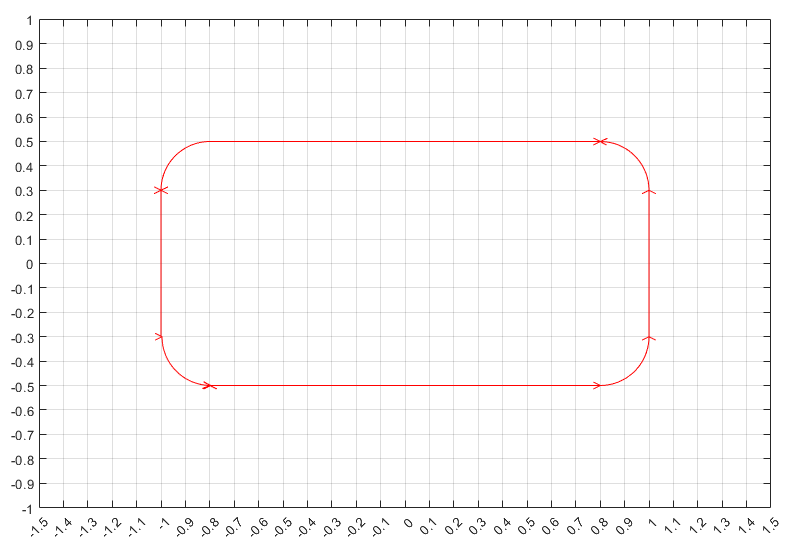
Model the geometry with rounded corners by subtracting the small squares from the rectangle, and then adding the circles. To do this, enter the following formula in the Set formula field.
R1-(SQ1+SQ2+SQ3+SQ4)+C1+C2+C3+C4
Switch to the boundary mode by clicking the
 button or selecting Boundary > Boundary Mode. The CSG model is now decomposed using the set formula, and you
get a rectangle with rounded corners.
button or selecting Boundary > Boundary Mode. The CSG model is now decomposed using the set formula, and you
get a rectangle with rounded corners.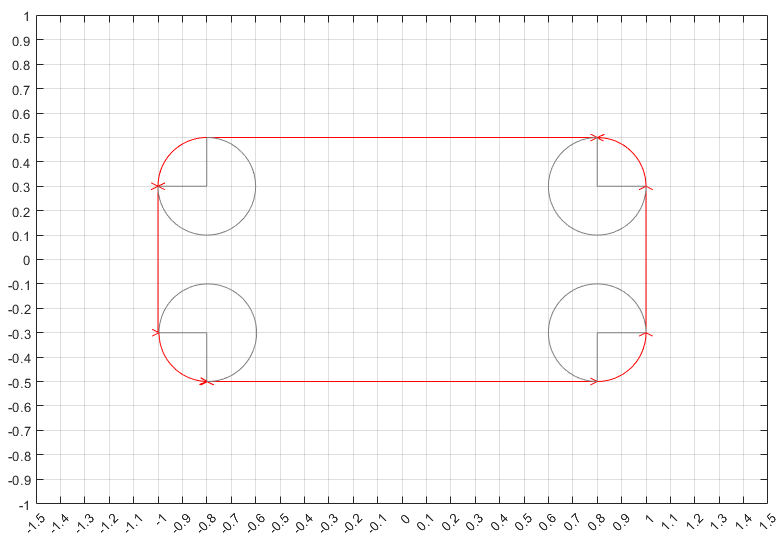
Because of the intersection of the solid objects used in the initial CSG model, a number of subdomain borders remain. They appear as gray lines. To remove these borders, select Boundary > Remove All Subdomain Borders.