plotResponse
System object: phased.RangeDopplerResponse
Namespace: phased
Plot range-Doppler response
Syntax
plotResponse(H,x)

plotResponse(H,x,xref)

plotResponse(H,x,coeff)

plotResponse(___,Name=Value)

hPlot = plotResponse(___)
Description
plotResponse( plots the
range-Doppler response of the input signal, H,x)x, in decibels. This
syntax is available when you set the RangeMethod
property to "FFT" and the DechirpInput property to false.
plotResponse(
plots the range-Doppler response after performing a dechirp operation on
H,x,xref)x using the reference signal, xref. This
syntax is available when you set the RangeMethod
property to "FFT" and the DechirpInput property to true.
plotResponse(
plots the range-Doppler response after performing a matched filter operation on
H,x,coeff)x using the matched filter coefficients in
coeff. This syntax is available when you set the RangeMethod property to "Matched
filter".
plotResponse(___, plots the
angle-Doppler response with additional options specified by one or more
Name=Value)Name=Value pair arguments.
hPlot = plotResponse(___)
Input Arguments
| Range-Doppler response object. |
| Input data. Specific requirements depend on the syntax:
In the case of an FMCW waveform with a triangle sweep, the sweeps
alternate between positive and negative slopes. However,
You can specify this argument as single or double precision. |
| Reference signal, specified as a column vector having the same number of rows as
|
| Matched filter coefficients, specified as a column vector. You can specify this argument as single or double precision. |
Name-Value Arguments
Examples
Compute the range-Doppler response of an FMCW signal using an FFT.
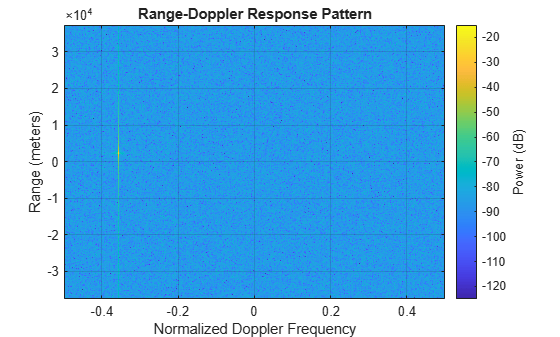
Load data for an FMCW signal that has not been dechirped. The signal contains the return from a target about 2200 m away. The signal has a normalized Doppler frequency of approximately -0.36 relative to the radar.
load RangeDopplerExampleData;Create a range-Doppler response object.
hrdresp = phased.RangeDopplerResponse(...
   RangeMethod="FFT",...
   PropagationSpeed=RangeDopplerEx_Dechirp_PropSpeed,...
   SampleRate=RangeDopplerEx_Dechirp_Fs,...
   DechirpInput=true,...
   SweepSlope=RangeDopplerEx_Dechirp_SweepSlope);
Plot the range-Doppler response.
plotResponse(hrdresp,...
   RangeDopplerEx_Dechirp_X,RangeDopplerEx_Dechirp_Xref,...
   Unit="db",NormalizeDoppler=true)
See Also
Topics
- Automotive Adaptive Cruise Control Using FMCW Technology (Radar Toolbox)