Triage and Assign Results in Polyspace Access Web Interface
Polyspace® Access™ offers a centralized database where you can store Polyspace analysis results for sharing with your team and performing collaborative reviews. Once analysis results are uploaded to Polyspace Access, a common next step is to filter and assign results to team members. Use the Polyspace Access dashboards and links to access results. Use filters to review and sort the results that you want to assign.
Log into the Polyspace Access web interface by using a web browser. The Polyspace Access user interface supports light and dark color schemes. To control the color scheme, set your operating system color scheme, or use the appearance settings for your web browser. The appearance settings for your web browser take precedence over the operating system color scheme.
Open the Project Explorer on the left side and select your project run. Projects are listed in a file-folder organization system. A project folder can contain additional sub-folders or individual project runs. You can use the filter at the top of the Project Explorer to search for uploaded results. After you select your results, the Project Overview dashboard opens, displaying your results.
If you select a folder, the dashboard shows an aggregate of the statistics for all the project runs in that folder.
Navigate the Polyspace Access Web Interface Dashboard
After you select your project run in the Project Explorer, the Project Overview dashboard opens for those results. The Project Overview dashboard shows a snapshot of the project including:
What findings currently exist.
The type and status of the findings.
Tracking of open findings over time.
The dashboard is split into multiple sections:
Summary
The Summary is the main section of the Project Overview dashboard and shows a snapshot of the project. This section contains cards showing Open Issues, Code Metrics, Quality Objectives, Defects (Bug Finder only), Run-time Checks (Code Prover only), and Coding Standards.
Trends
The Trends section uses a graph to show the number of open findings over time. When you select a project run, the graph shows the open findings trend over time, starting from the first run uploaded to the project up to the currently selected run. Each dot on the trend line represents a project run.
Details
The Details section enables users to take a closer look at the project in a table. This table shows the total number of coding standards violations and their status. The status and number of defects is shown (Bug Finder only). The status and number of global variables and red, gray, orange, and green checks is shown (Code Prover only). Click any table entry to view the corresponding results in the Results List.
Summary Section Overview
The Summary section contains the cards listen in this table:
| Card | Description |
|---|---|
| Open Issues | Shows the total number of open issues, new issues compared to the previous run, the number of open issues that are assigned to the current user, and the total number of unassigned issues. Click any of these links to view the corresponding results in the Results List. |
| Code Metrics | Shows the total number of subprojects, number of files, number of lines without comments, and the biggest cyclomatic complexity value of the code. Click the “Code Metrics” link to open the Code Metrics dashboard in a new tab. See Code Metrics Dashboard in Polyspace Access Web Interface . |
| Quality Objectives | Shows the completion percentage of all quality objectives and the remaining quality objectives as defined by the current threshold. A label next to the percentage bar shows the analysis status. For example, the label reads Incomplete if checkers required for the selected threshold were not activated in the analysis. Click the “Quality Objectives” link to open the Quality Objectives dashboard in a new tab. You can create user-defined thresholds for quality objectives. See Monitor Code Quality Using Quality Objectives Dashboard in Polyspace Access. |
| Defects (Bug Finder only) | Shows the current number of open defects along with their status. Click the “Defects” link to open the Defects dashboard in a new tab. This dashboard shows a more detailed breakdown of all open defects and provides the ability to view defects by category or by file. See Defects (Polyspace Bug Finder) . |
| Run-time Checks (Code Prover Only) | Shows the current number of red, orange, gray, and green run-time checks. Click the "Run-time Checks" link to open the Run-time Checks dashboard in a new tab. This dashboard shows a more detailed breakdown of open run-time checks and provides the ability to view run-time checks by category or by file. See Run-Time Checks (Polyspace Code Prover). |
| Coding Standards | Shows the current number of open coding standard issues and their status. Click the “Coding Standards” link to open dashboards for the coding rules in new tabs. These dashboards can include the Custom Rules dashboard, the Guidelines dashboard, and the dashboards for whichever coding standards are activated for the project such as MISRA C:2012 or SEI CERT C. See Coding Standards (Polyspace Bug Finder) .The different coding standards dashboards enable you to view a more detailed breakdown of all open coding standard issues including the ability to view coding standard issues by category or by file. |
Clicking any link within the tables takes you to the Review page with the relevant filters applied.
Navigate the Results List, Result Details, and Source Code Panels
In many cases, clicking a link on the Project Overview dashboard opens the Review page. The Review page is separated into three major panes:
Results List
Result Details
Source Code
To view additional panes available in the Polyspace user interface, including Review History and Call Hierarchy, on the toolstrip, click Window and select a pane.
Results List
The Results List contains all the results matching the filters that are set. No other issues are displayed unless you remove these filters. Click the pink eraser icon next to the filters to remove all filters. Place your cursor over an individual filter to open the option to remove the filter.
The Results List is organized in a table format. You can sort each column by clicking the column title. You can further filter results at an item level. For the item that you want to filter, right-click the row of the item in the column you want to filter by. This shows the options to filter out or show only the value in the cell. You can also set the Show only and Filter out values in the Filters section on the toolstrip. See also Results List in Polyspace Access Web Interface
Result Details
Result Details shows detailed information about individual results, including additional information about the result, links to relevant documentation, and review information such as status, severity, and comments. Select a result in the Results List to display the result information in the Result Details pane. See Result Details in Polyspace Access Web Interface
When applicable, the trace of events shows the events that lead to the error. Click the event to highlight the relevant line of code in the Source Code pane.
You can also create a bug tracking ticket and assign an owner to a result. See Assign Status and Owner to Results
Source Code
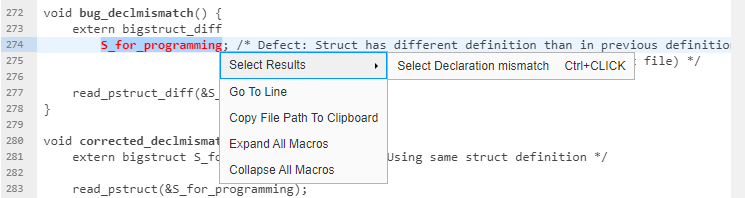
The Source Code pane shows the location of the result in the source code. You cannot make edits in the Source Code pane. Select a result in the Results List to see it in the Source Code pane. Right-click in the Source Code pane to:
Quickly navigate to a line in the file.
Search for all references of a variable.
Copy the file path to your clipboard.
Expand or collapse macros.
If multiple results are at the same location in the code, right-click the relevant code to select one of the results to focus on with the Select Results option. See Source Code in Polyspace Access Web Interface
Filter Polyspace Access Results
The toolstrip displays several additional options for navigation and filtering.
Custom Filters
Apply and create custom filters. See also Create Custom Filter Groups in Polyspace Access Web Interface.
Family Filters
Quickly apply filters by result type. For instance, clicking Defects filters to show only defect type results. Clicking the arrow next to the Defects filter specifies viewing high, medium, or low defects. Similarly, Run-time Checks, Coding Standards, and Code Metrics enable further narrowing the scope of your review with additional options in the drop down list.
Filters
The Filters section contains quick filters as listed in this table:
| Filter | Value |
|---|---|
| Workflow |
|
| Resolution |
See also Compare Results in Polyspace Access Project to Previous Runs |
| Assignee |
|
| Status |
|
| Severity |
See also Classification of Defects by Impact (Polyspace Bug Finder) |
| Software Quality Objectives | Individual filters for SQO1 through Exhaustive See also Evaluate Polyspace Bug Finder Results Against Bug Finder Quality Objectives (Polyspace Bug Finder) |
Use the Show only filter to show results associated with the keyword, file name, or comment in the Show only field. Use Filter out to remove results associated with the keyword, file name, or comment in the Filter out field.
You can apply the Show only and Filter out filters by right-clicking the Results List table. Each column allows for the filtering of different parameters. Right-click in the cell containing the phrase that you want to filter and select Show only or Filter out to apply the filter.
Assign Status and Owner to Results
You can set up email alerts so that component owners get notified when Polyspace results appear in their components. See Send Email Notifications with Polyspace Bug Finder Server Results (Polyspace Bug Finder)
To assign a user to a result, select the result that you want to assign from the Results List. In the Result Details pane, use the Assigned to drop-down list to select the user you want to assign the results to. Alternatively, begin typing the user name and select them from the autocomplete list. To unassign a user, click the x icon to the right of the Assigned to drop-down list.
To assign a status, severity, or comment, in the Result Details pane, choose a Status and Severity from the drop-down lists. Comments are entered in the text field to the right of the drop down.
To select multiple results, hold the Ctrl key and click each result. If you want to select a group of results, click the first result, hold the Shift key, then scroll to and click the last result. To select all results currently showing in the results list, right-click a result and click Select All in the context menu.
If your bug tracking tool is integrated with Polyspace
Access, you can use the Ticket section to create a ticket based on the result. Click ![]() to create a ticket or click
to create a ticket or click ![]() to link an existing ticket. See Create Bug Tracking Tool Tickets from the Polyspace Access Web Interface
to link an existing ticket. See Create Bug Tracking Tool Tickets from the Polyspace Access Web Interface