Passive Bistatic Radar Performance Assessment
Passive bistatic radar (PBR) is a type of radar system that leverages existing external signals, known as illuminators of opportunity, for the detection and tracking of targets. Unlike traditional radars, passive radars do not generate their own signals. Instead, they utilize existing signals from sources such as commercial radio and television broadcasts or cellular network signals. The key advantages of bistatic radar systems include:
Stealth: The passive receivers are challenging to detect due to their non-emissive nature.
Spectrum Usage: Passive radars do not require dedicated frequency bands within the electromagnetic spectrum, avoiding spectrum congestion.
Cost Effective: Deploying passive radar systems can be considerably more affordable than setting up traditional radar systems with dedicated transmitters.
Flexibility: Passive radar systems can be set up in various configurations and locations given the ubiquitous presence of broadcast signals.
Enhanced Target Detection: The bistatic configuration can potentially aid in detection of stealthy targets.
This example focuses on evaluating the performance of a passive bistatic radar using a typical FM radio transmitter as the illuminator of opportunity. It begins with an explanation of the standard bistatic radar equation, which is invariant with range, azimuth, and elevation. Following this, it examines the impact of antenna patterns from both the transmitter and receiver. The discussion then extends to the radar propagation factor, considering the transmitter and receiver, which accounts for environmental effects such as multipath and refraction. Finally, the bistatic radar equation is refined to incorporate the influences of antenna patterns and propagation factors, offering a more accurate assessment of the bistatic radar system's capabilities.
This example uses Radar Toolbox™ and Mapping Toolbox™.
Bistatic Radar Equation
The image below shows the bistatic geometry for the 2-dimensional case. The transmitter and receiver sites reside along the x-axis. The line between the transmitter and receiver is referred to as the baseline () or direct path. The line from the transmitter to the target is the range and the range from the receiver to the target is the range . The azimuth is the counterclockwise angle in the x-y plane measured in degrees from the positive x-axis. The origin is at the midpoint of the baseline.
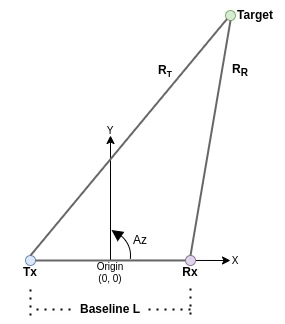
An oval of Cassini is the locus of the vertex (the target) of a triangle that is formed when the product of the sides adjacent to the vertex ( and ) is constant and the length of the opposite side () is fixed. The ovals of Cassini are contours or surfaces of constant Signal-to-Noise Ratio (SNR) calculated as
,
where is the bistatic radar constant typically defined as
.
The table below describes the variables that contribute to the bistatic radar constant.
Parameter | Description | Units |
|---|---|---|
Transmitter power | Watts | |
Transmitter and receiver gains, respectively | No units | |
Wavelength | meters | |
Radar Cross Section (RCS) | square-meters | |
Propagation factors for paths from transmitter or receiver to the target | No units | |
Boltzmann's constant | J/K | |
Receiver system noise temperature | Kelvin | |
Receiver noise bandwidth | Hz | |
Transmitter and receiver losses | No units |
It is instructive to plot the ovals of Cassini as a function of SNRs rather than just the minimum SNR required for detectability. Example ovals of Cassini with are plotted below.
% Inputs
txpos = [-1e3 0];             % Transmitter position (m)
rxpos = [1e3 0];              % Receiver position (m)
L     = norm(txpos - rxpos);  % Baseline distance (m)
K     = pow2db(30*L^4);       % Bistatic radar constant K (dB)
SNRs  = [10 13 16 20 23 30];  % SNRs (dB)

% Calculate bistatic constant SNR contours
bistaticConstantSNR(txpos,rxpos,K,SNR=SNRs,IncludeCusp=true)
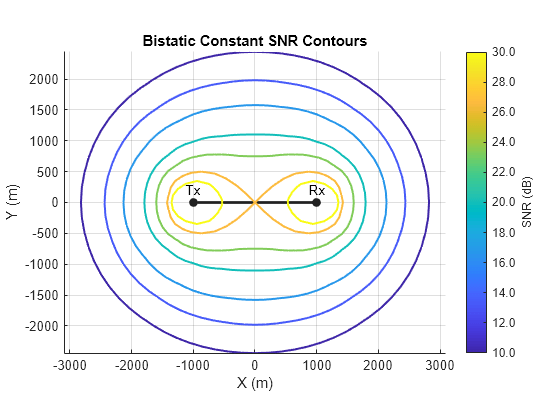
The ovals increase in size as SNR decreases, and the ovals shrink as SNR increases. Eventually the ovals shrink to the point that they collapse around the transmit and receive sites. The point on the baseline at which the ovals break apart into two contours is called the cusp. The oval is a lemniscate at this SNR.
The standard bistatic radar equation assumes that the bistatic RCS, propagation paths, and losses are invariant with range, azimuth, and elevation, which is usually not the case. However, the invariance assumption is useful to understand basic relationships and constraints. The next section will show how to calculate ovals of Cassini for a more realistic scenario.
Define the Passive Radar Scenario
Define a passive bistatic radar scenario. Set the slant range between the transmitter and receiver to 100 km and set the heights of the transmitter and receiver to 200 and 15 meters, respectively. The target is at a constant height of 10 km.
% Define bistatic scenario SR =100000; % Slant range (m) hgtTx =
200; % Transmitter height (m) hgtRx =
15; % Receiver height (m) hgtTgt =
10000; % Target height (m)
The FM radio transmitter will be placed at a geodetic location that corresponds to Natick, Massachusetts in the United States.
% Positions
txPosGeo = [42.281342 -71.354950 hgtTx]; % Latitude (deg), longitude (deg), altitude (m)
Convert the receiver height previously defined to an elevation angle relative to the transmitter using the height2el function.
% Convert receiver height to receiver elevation angle
elRx = height2el(hgtRx,hgtTx,SR,'Curved',physconst('EarthRadius'));
txPos = [-SR/2 0];
rxPos = [SR/2 0];
This example will define the Earth as a simple spheroid.
% Reference sphere
sph = referenceSphere('Earth')
sph =
referenceSphere with defining properties:

          Name: 'Earth'
    LengthUnit: 'meter'
        Radius: 6371000

  and additional properties:

    SemimajorAxis
    SemiminorAxis
    InverseFlattening
    Eccentricity
    Flattening
    ThirdFlattening
    MeanRadius
    SurfaceArea
    Volume
Next, calculate the geodetic receiver position relative to the transmitter.
% Calculate the receiver position relative to transmitter
[rxPosGeo(1),rxPosGeo(2),rxPosGeo(3)] = aer2geodetic(90,elRx,SR, ...
    txPosGeo(1),txPosGeo(2),txPosGeo(3),sph);
Now, define parameters for the bistatic radar constant calculation. The bistatic radar constant can be easily calculated using the radareqsnr function with range equal to 1 meter.
% Radar equation parameters
PtGt   = 100e3; % Transmitter power and gain (Watts)
Gr     = 0;     % Receiver gain (dB)
sigma  = 10;    % Target RCS (square meters)
lambda = 3;     % Wavelength (m)
B      = 50e3;  % Bandwidth (Hz)
T      = 1;     % Pulse width (sec)
LdB    = 10;    % Loss (dB)
FdB    = 5;     % Noise figure (dB)
T0     = 290;   % Reference temperature (Kelvin)

% Calculate bistatic radar constant K
Pn = pow2db(B) + FdB;
Ltotal = LdB + Pn;
K = radareqsnr(lambda,1,PtGt,T,RCS=sigma,Gain=[0 Gr],Loss=LdB)
K =
230.5413
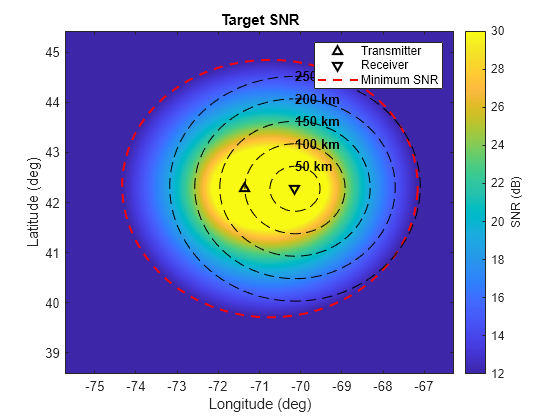
Next, calculate the bistatic constant SNR curves using the bistatic radar constant K. This calculation assumes that the bistatic RCS, propagation paths, and losses are invariant with range, azimuth, and elevation. This will be the starting point for this example. This example will assume that 12 dB is the minimum detectable SNR.
% Calculate constant SNR curves
M   = bistaticConstantSNR(txPos,rxPos,K,SNR=12:30,RangeLimits=[1 400e3]); % Constant SNR contours
M12 = bistaticConstantSNR(txPos,rxPos,K,SNR=12,RangeLimits=[1 400e3]);    % 12 dB minimum detectable SNR
Convert the Cartesian bistatic constant SNR contours to geodetic coordinates using the helper helperCart2Geo, which uses the aer2geodetic function.
% Helper converts Cartesian constant SNR contours to geodetic coordinates
[lonVec,latVec,lonG,latG,snrsIdeal] = helperCart2Geo(txPosGeo,rxPosGeo,M,sph);
Plot the standard bistatic radar equation using helperPlotScenario. The transmitter is denoted by the upward-facing black triangle, and the receiver is denoted by the downward-facing black triangle. The black dotted rings centered about the receiver are contours of constant range from 50 km to 250 km to aid with visual assessment. Beyond the red dotted line are SNRs below 12 dB, the minimum detectable SNR. The 12 dB contour is past the 250 km line, which is optimistic. The plot has been set to saturate at 30 dB.
% Plot standard bistatic radar equation
figure
hAxes = axes;
imagesc(hAxes,lonVec,latVec,snrsIdeal)
title(hAxes,'Target SNR')

% Plot scenario
helperPlotScenario(hAxes,M12,txPosGeo,rxPosGeo,'receive',sph,'SNR (dB)')
clim(hAxes,[12 30])
Define the Transmitter
The previous calculation assumes that the target is illuminated through the maximum of the transmitter and receiver radiation patterns, which is often not the case. The azimuth and elevation patterns of the antennas can significantly degrade performance in certain directions. This section and subsequent sections explore those impacts.
Transmitter Antenna Azimuth Pattern
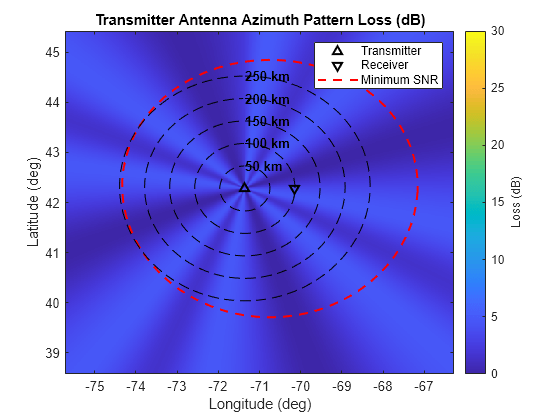
Below is an example of a standard azimuth radiation pattern for an FM radio station. Such patterns are often referred to as omnidirectional despite the evident losses. Such radiation patterns are typically due to the fact that FM transmitters are often composed of panels that are installed around a mast or tower to provide 360-degree coverage. The number of panels are typically 3, 4, or 5. The variation in the pattern is due to the sum of the individual panel patterns. The helperCalcTxAzPattern outputs a transmitter azimuth pattern typical of a 4 panel FM transmitter.
% Transmitter antenna azimuth magnitude pattern (dB)
[txAzPat,txAzAng] = helperCalcTxAzPattern(); 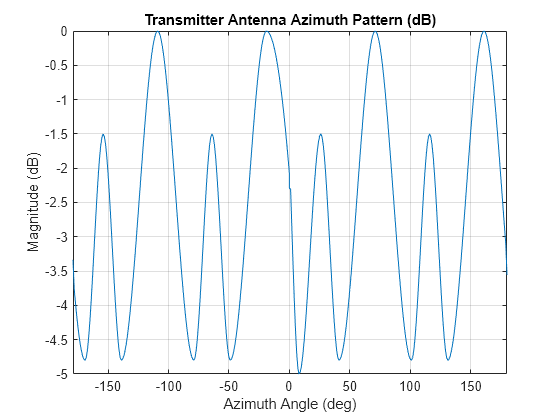
Transmitter Antenna Azimuth Pattern Loss
Below shows a map of the losses due to the transmitter azimuth radiation pattern. Losses more than 4 dB can be seen in certain directions in the plot below.
The black dotted rings centered about the transmitter are contours of constant range from 50 km to 250 km to aid with visual assessment. The red dotted line denotes the 12 dB minimum detectable SNR.
% Transmitter antenna pattern loss (dB)
numSamples = size(latG,1);
azG = geodetic2aer(latG(:),lonG(:),hgtTgt*ones(size(latG(:))),txPosGeo(1),txPosGeo(2),txPosGeo(3),sph);
azTxLoss = interp1(txAzAng,-mag2db(txAzPat),azG,'linear');
azTxLoss = reshape(azTxLoss,numSamples,numSamples);

% Plot transmitter antenna pattern loss (dB)
figure
hAxes = axes;
imagesc(hAxes,lonVec,latVec,azTxLoss);
title(hAxes,'Transmitter Antenna Azimuth Pattern Loss (dB)')

% Plot scenario
helperPlotScenario(hAxes,M12,txPosGeo,rxPosGeo,'transmitter',sph,'Loss (dB)')
clim(hAxes,[0 30])
Transmitter Elevation Pattern
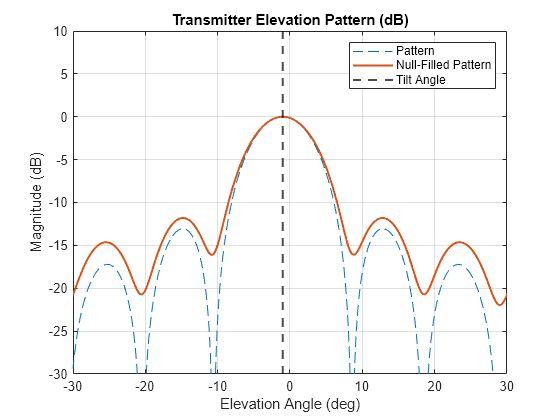
The elevation pattern of an FM radio station is typically designed such that power is radiated downward towards users. The elevation beam patterns often exhibit narrow beamwidths and are tilted downward. This example models the transmitter elevation pattern as a simple uniform linear array (ULA) with 8, 12, or 16 elements with half-wavelength spacing. A ULA with 12 elements is chosen and is given a -1 degree tilt downward. The 3-dB beamwidth in this case is about 11 dB. A target traveling at a constant height can easily fall into a minimum of the elevation radiation pattern or be illuminated by the sidelobes, since the mainlobe width is so small.
A common procedure to prevent significant nulling at certain elevation angles for FM radios is to perform a procedure called null-filling. The helperCalcTxElPattern performs null-filling by moving the roots of the array factor polynomial outside of the unit circle. The resulting pattern shows that the deep sidelobe nulls are no longer present. This is accomplished at the expense of a slight broadening of the mainlobe and an increase in the sidelobe levels. The helper applies a linear amplitude distribution to reduce ripples but maintain mainlobe width.
% Transmitter elevation pattern (dB) txElTiltAng = -1; % Transmitter tilt angle (deg) numTxEl =12; % Number of elements in linear array % Calculate and plot transmitter elevation pattern [txElPat,txElAng] = helperCalcTxElPattern(numTxEl,txElTiltAng);
Combined Transmitter Azimuth and Elevation Pattern Losses
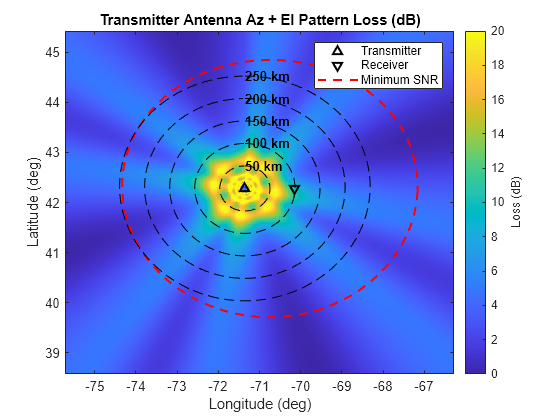
The combined effects of the transmitter azimuth and elevation antenna patterns is shown below.
The appearance of this plot will be particularly affected by the target height. Try different target heights and view the resulting losses. Low flying targets will be illuminated by the mainlobe of the elevation radiation pattern most of the time. However, higher altitude targets like the default 10 km target height evidence rings of losses. This is due to the target passing through the minima of the transmitter elevation pattern.
% Calculate losses caused by elevation pattern
[~,elG] = geodetic2aer(latG(:),lonG(:),hgtTgt*ones(size(latG(:))),txPosGeo(1),txPosGeo(2),txPosGeo(3),sph);
elTxLoss = interp1(txElAng + txElTiltAng,-mag2db(txElPat),elG,'linear');
elTxLoss = reshape(elTxLoss,numSamples,numSamples);

% Plot losses caused by combined transmitter azimuth and elevation pattern
figure
hAxes = axes;
imagesc(hAxes,lonVec,latVec,azTxLoss + elTxLoss);
helperPlotScenario(hAxes,M12,txPosGeo,rxPosGeo,'transmitter',sph,'Loss (dB)')
title(hAxes,'Transmitter Antenna Az + El Pattern Loss (dB)')
clim(hAxes,[0 20])
Define the Receiver
Receiver Antenna Array
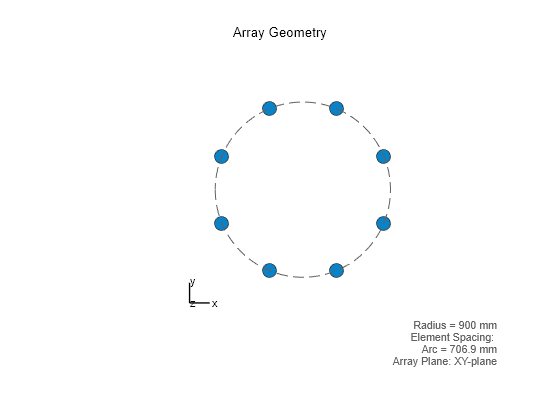
To ensure 360-degree coverage, the receive antenna array is modeled as a uniform circular array (UCA). Each element is a vertically polarized short dipole antenna element.
% Define receiver UCA
azRxEle         = phased.ShortDipoleAntennaElement; % Vertical element
azRxRad         = 0.9;                              % UCA radius (m)
azRxNumElements = 8;                                % Number of elements in UCA
azRxArray       = phased.UCA(azRxNumElements,azRxRad,Element=azRxEle); % UCA
figure
viewArray(azRxArray)
Effective Receiver Azimuth Pattern
It is common for passive receivers to implement some sort of direct path interference (DPI) cancellation in order to improve the detection of target returns. Often this is performed by:
Adding nulls in the known direction of the transmitter
Using a reference beam or antenna
Adaptive filtering in the spatial/time domain
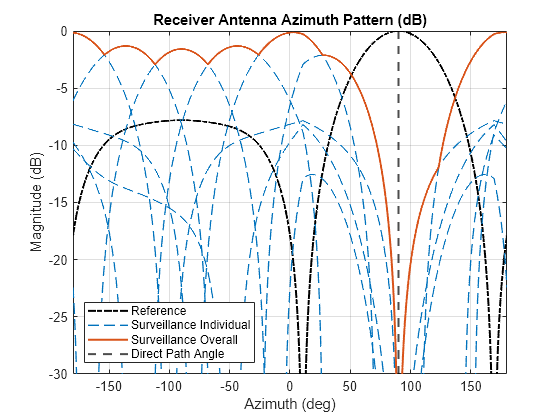
This example performs direct path interference mitigation by using a reference beam. Eight beams are defined. One of those beams (the one at 90 degrees) is used to null the direct path.
% Define beams
azRxNumBeams    = 8;                                      % Number of beams
azRxAngSpace    = 360/azRxNumBeams;                       % Angle spacing (deg)
azRxSteerAng    = -180:azRxAngSpace:(180 - azRxAngSpace); % Azimuth steering angles (deg)
azRxNullAng     = 90;                                     % Null angle (deg)

% Steering vector
sv              = phased.SteeringVector(SensorArray=azRxArray);

% Form surveillance Beams
freq        = wavelen2freq(lambda); % Frequency (Hz)
rxAzAng     = -180:0.1:180;         % Azimuth angles (deg)
azRxPat     = zeros(numel(rxAzAng),azRxNumBeams - 1); % Pattern
idxAllBeams = 1:azRxNumBeams;
idxBeams    = idxAllBeams(azRxSteerAng ~= azRxNullAng);
for ii = 1:(azRxNumBeams - 1)
    azRxSV = sv(freq,azRxSteerAng(ii));
    azRxPat(:,ii) = pattern(azRxArray,freq,rxAzAng,0,Weights=azRxSV,Type='efield');
end

% Form null Beam
idxNull = idxAllBeams(azRxSteerAng == azRxNullAng);
azRxSV = sv(freq,azRxSteerAng(idxNull));
azRxPatRef = pattern(azRxArray,freq,rxAzAng,0,Weights=azRxSV,Type='efield');
The complex voltage reference pattern for the null beam is subtracted from the surveillance beams as
where is a scaling value where the numerator and denominator are the values of the patterns in the direction of the transmitter for the surveillance and reference beams, respectively.
The figure below shows the individual surveillance beams as dotted blue lines. The reference beam used for nulling is the dot-dash line in black. The null is evident at the desired 90 degree azimuth in each of the 7 surveillance beams. The scalloping loss due to the surveillance beams is about 3 dB at its worst.
The effective azimuth radiation pattern that is used in subsequent calculations is the maximum value of the seven effective surveillance beams. The effective receiver azimuth pattern is shown as a thick, solid red line.
% Calculate effective surveillance beams
idxTx = find(rxAzAng == azRxNullAng);
azRxPatEff = azRxPat - azRxPatRef.*azRxPat(idxTx,:)./azRxPatRef(idxTx);

% Calculate effective azimuth radiation pattern
azRxPatEffMax = max(azRxPatEff,[],2);

% Plot effective receiver pattern
figure
hAxes = axes;
hRef = plot(hAxes,rxAzAng,mag2db(abs(azRxPatRef)),'-.k',LineWidth=1.5);
hold(hAxes,'on')
hP = plot(hAxes,rxAzAng,mag2db(azRxPatEff),'--',SeriesIndex=1,LineWidth=1);
hEff = plot(hAxes,rxAzAng,mag2db(azRxPatEffMax),'-',SeriesIndex=2,LineWidth=1.5);
hNull = xline(hAxes,azRxNullAng,'--k',LineWidth=1.5);
legend(hAxes,[hRef,hP(1) hEff hNull],{'Reference','Surveillance Individual','Surveillance Overall','Direct Path Angle'},Location='southwest')
title(hAxes,'Receiver Antenna Azimuth Pattern (dB)')
xlabel(hAxes,'Azimuth (deg)')
ylabel(hAxes,'Magnitude (dB)')
grid(hAxes,'on')
axis(hAxes,'tight')
ylim([-30 0])
Receiver Antenna Azimuth Pattern Loss
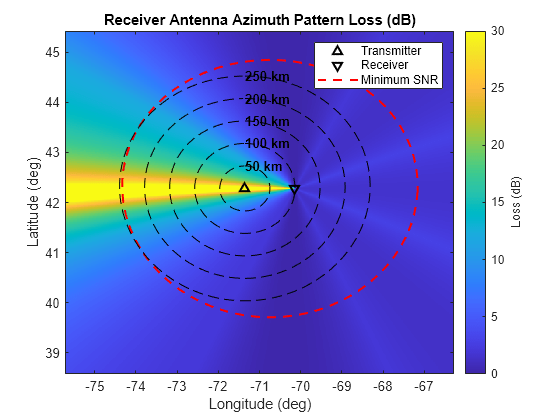
Below shows a map of the losses due to the effective receiver azimuth radiation pattern calculated in the previous section. The bright yellow region shows the direct path interference null. Target detection is not expected in that angular region.
% Calculate receiver antenna pattern loss (dB)
azG = geodetic2aer(latG(:),lonG(:),hgtTgt*ones(size(latG(:))),rxPosGeo(1),rxPosGeo(2),rxPosGeo(3),sph);
azRxLoss = interp1(wrapTo360(rxAzAng + 180),-mag2db(azRxPatEffMax),azG,'linear');
azRxLoss = reshape(azRxLoss,numSamples,numSamples);

% Plot receiver antenna pattern loss (dB)
figure
hAxes = axes;
imagesc(hAxes,lonVec,latVec,azRxLoss);
helperPlotScenario(hAxes,M12,txPosGeo,rxPosGeo,'receiver',sph,'Loss (dB)')
title(hAxes,'Receiver Antenna Azimuth Pattern Loss (dB)')
clim(hAxes,[0 30])
Radar Propagation Factor
The radar propagation factor is a one-way propagation calculation that takes into account:
Interference between the direct and ground-reflected rays (i.e., multipath)
Atmospheric refraction through the effective Earth radius approximation
Antenna elevation pattern
The radarpropfactor function takes into account 4 different regions:
Near region: A clear path exists, and the propagation factor is about 1.
Interference region: Surface reflections interfere with the direct ray in this region. There exists constructive and destructive interference from the surface reflections.
Intermediate region: There is a combination of interference and diffraction phenomenology.
Diffraction region: Diffraction is dominant.
It also includes a divergence factor that results from the Earth's curvature within the first Fresnel zone. Scattering and ducting are assumed to be negligible.
Transmitter Propagation Factor
Begin by defining the operational environment.
Use the refractiveidx function to determine an appropriate value for the refractive index. Based on the latitude of our transmitter and receiver, we will use the Mid-latitude model, which is appropriate for latitudes between 22 and 45 degrees. The mid-latitude model has seasonal profiles for summer and winter, which can be specified using the Season name-value pair. This example assumes the season is summer.
% Refractive index of the atmosphere
nidx = refractiveidx([0 1e3],LatitudeModel='Mid',Season='Summer');
Use the effearthradius function to set an effective Earth radius to approximate effects due to refraction. This is typically modeled as a 4/3 Earth radius for a standard atmosphere. This example calculates it directly from the selected atmosphere model.
% Effective Earth Radius
rgradient = (nidx(2) - nidx(1))/1e3;   % Refractive gradient
Re        = effearthradius(rgradient); % Effective earth radius (m)
Determine an appropriate surface relative permittivity value. The helperSurfaceRelativePermittivity function sets appropriate values for the ITU soil model for the earthSurfacePermittivity function. Four types of soil are included in this helper:
Sandy loam
Loam
Silty loam
Silty clay
% Electrical properties of the soil surface
epsc = helperSurfaceRelativePermittivity("one",freq);
Use the landroughness function to determine appropriate values for the surface height standard deviation and surface slope. These values can be directly calculated from terrain data when available. This example assumes a smooth surface.
% Surface standard deviation and slope
[hgtsd,beta0] = landroughness('smooth');
Now, calculate the propagation factor. The transmitter is assumed to be vertically polarized.
% Transmitter propagation factor
propRng = logspace(0,6,1e5); % Range (m)
pol = 'V';
txPF = radarpropfactor(propRng,freq,txPosGeo(3),hgtTgt, ...
    Polarization=pol,AntennaPattern=txElPat,PatternAngles=txElAng,Tilt=txElTiltAng, ...
    SurfaceSlope=beta0,SurfaceHeightStandardDeviation=hgtsd, ...
    SurfaceRelativePermittivity=epsc, ...
    RefractiveIndex= nidx(1),EffectiveEarthRadius=Re);
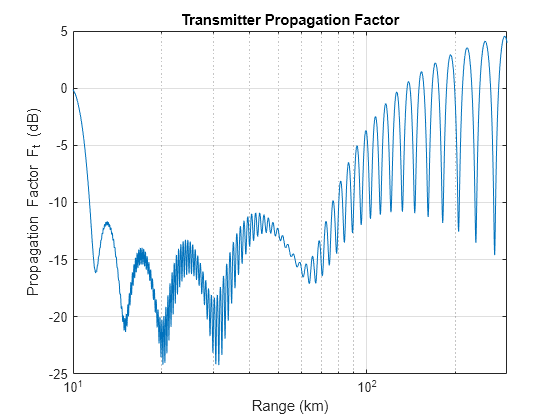
The propagation factor is plotted below. Note that the plot below shows a great deal of multipath lobing due to the 200 meter height of the transmitter and the elevation pattern.
% Plot transmitter propagation factor
figure
hAxes = axes;
semilogx(hAxes,propRng*1e-3,txPF)
xlabel(hAxes,'Range (km)')
ylabel(hAxes,'Propagation Factor F_t (dB)')
title(hAxes,'Transmitter Propagation Factor')
grid(hAxes,'on')
xlim(hAxes,[hgtTgt*1e-3 300])
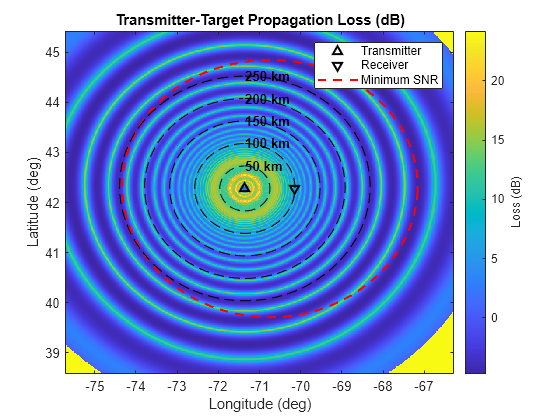
The transmitter-to-target path loss is plotted below. Significant multipath lobing is seen, which would negatively impact target detection.
The greatest losses are at the edges. This is due to the curvature of the Earth. These losses would be at much closer ranges for a lower elevation target.
% Pattern propagation factor map for transmitter-target path
[~,~,rG] = geodetic2aer(latG(:),lonG(:),hgtTgt*ones(size(latG(:))),txPosGeo(1),txPosGeo(2),txPosGeo(3),sph);
txPFLoss = interp1(propRng,-txPF,rG,'linear');
txPFLoss = reshape(txPFLoss(:),numSamples,numSamples);
figure
hAxes = axes;
imagesc(hAxes,lonVec,latVec,txPFLoss)
helperPlotScenario(hAxes,M12,txPosGeo,rxPosGeo,'transmitter',sph,'Loss (dB)')
title(hAxes,'Transmitter-Target Propagation Loss (dB)')
Receiver Propagation Factor
Model the receiver elevation antenna pattern as a cosine-pattern, which is an approximation for a half-wavelength dipole.
% Half-wavelength dipole approximation
rxElAng = -90:0.1:90;
rxElPat = cosd(rxElAng);
Now calculate and plot the receiver propagation factor using the same environmental settings as defined in the previous section. Assume that the transmitter and receiver are polarization matched.
% Receiver propagation factor
rxPF = radarpropfactor(propRng,freq,rxPosGeo(3),hgtTgt, ...
    Polarization=pol,AntennaPattern=rxElPat,PatternAngles=rxElAng, ...
    SurfaceSlope=beta0,SurfaceHeightStandardDeviation=hgtsd, ...
    SurfaceRelativePermittivity=epsc, ...
    RefractiveIndex=nidx(1),EffectiveEarthRadius=Re);

% Plot receiver propagation factor
figure
hAxes = axes;
semilogx(hAxes,propRng*1e-3,rxPF)
xlabel(hAxes,'Range (km)')
ylabel(hAxes,'Propagation Factor F_t (dB)')
title(hAxes,'Receiver Propagation Factor')
grid(hAxes,'on')
xlim(hAxes,[hgtTgt*1e-3 300])
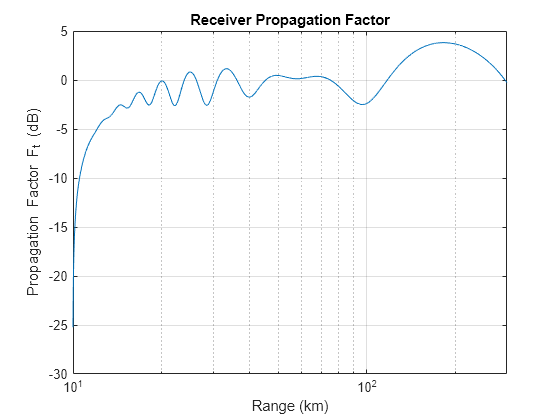
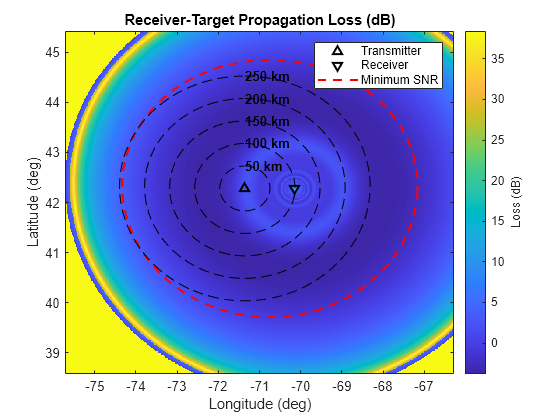
The target-to-receiver path loss is plotted below. The lobing in this case is not as severe as the transmitter since the receiver is at a lower elevation and its elevation pattern does not have sidelobes.
Again, the greatest losses are at the edges due to the curvature of the Earth.
% Pattern propagation factor map for receiver-target path
[~,~,rG] = geodetic2aer(latG(:),lonG(:),hgtTgt*ones(size(latG(:))),rxPosGeo(1),rxPosGeo(2),rxPosGeo(3),sph);
rxPFLoss = interp1(propRng,-rxPF,rG,'linear');
rxPFLoss = reshape(rxPFLoss(:),numSamples,numSamples);
figure
hAxes = axes;
imagesc(hAxes,lonVec,latVec,rxPFLoss)
helperPlotScenario(hAxes,M12,txPosGeo,rxPosGeo,'receiver',sph,'Loss (dB)')
title(hAxes,'Receiver-Target Propagation Loss (dB)')
Target SNR Including Antenna Patterns and Propagation Factors
This last section combines the standard form of the bistatic range equation with the previously calculated losses for both transmitter and receiver:
Azimuth pattern losses
Elevation pattern losses
Radar propagation factors
The figure below shows a more realistic bistatic radar SNR. It is evident that the target detection capability has degraded. Detection has declined considerably in the direction of the direct path, which is expected. Multipath lobing is seen, and there are areas where the target may be in a multipath fade.
% Target SNR including antenna patterns and propagation factor
snrsAct = snrsIdeal - azTxLoss - azRxLoss - rxPFLoss - txPFLoss;
figure
hAxes = axes;
imagesc(hAxes,lonVec,latVec,snrsAct);
helperPlotScenario(hAxes,M12,txPosGeo,rxPosGeo,'receiver',sph,'SNR (dB)')
title(hAxes,['Target SNR Including' newline 'Antenna Patterns and Propagation Factors'])
clim(hAxes,[12 30])

Summary
This example provided an assessment of passive radar performance using an FM radio signal as an illuminator of opportunity. Initially, it showcased how to calculate the Signal-to-Noise Ratio (SNR) using the standard bistatic radar equation. Subsequently, it introduced a method to refine this calculation by incorporating the effects of both the transmitter and receiver antenna patterns, along with their associated propagation factors. This approach leads to a more accurate and realistic evaluation of a bistatic radar system's performance.
The findings from this example are versatile and can be adapted to various scenario geometries, as well as different types of transmitter and receiver antennas. The methodology outlined can be applied to:
Designing a bistatic radar system
Mission planning
Performance assessment and optimization
References
Lindmark, Bjorn. “Analysis of Pattern Null-Fill in Linear Arrays.” In Proceedings of 7th European Conference on Antennas and Propagation (EuCAP), 2013.
Malanowski, Mateusz, Marcin Zywek, Marek Plotka, and Krzysztof Kulpa. “Passive Bistatic Radar Detection Performance Prediction Considering Antenna Patterns and Propagation Effects.” IEEE Transactions on Geoscience and Remote Sensing 60 (2022): 1–16.
Willis, Nicholas J. Bistatic Radar. Raleigh, NC: SciTech Publishing, Inc., 2005.
Yamamoto, Masashi, Hiroyuki Arai, Yoshio Ebine, and Masahiko Nasuno. “Simple Design of Null-Fill for Linear Array.” In Proceedings of ISAP2016. Okinawa, Japan: IEEE, 2016.
Helpers
helperCart2Geo
function [lonVec,latVec,lonG,latG,snrsIdeal] = helperCart2Geo(txPosGeo,rxPosGeo,M,sph)
% Helper converts Cartesian constant SNR contours to geodetic coordinates

% Determine plot boundaries
xC = [M.X];
yC = [M.Y];
[azC,~,rngC] = cart2sph(xC(:),yC(:),zeros(size(xC(:))));
[latSnr,lonSnr] = aer2geodetic(rad2deg(azC)-90,zeros(size(azC)),rngC,(txPosGeo(1)+rxPosGeo(1))/2,(txPosGeo(2)+rxPosGeo(2))/2,(txPosGeo(3) + rxPosGeo(3))/2,sph);
latGlims = [(floor(min(latSnr(:))) - abs(mean(latSnr)*0.01)) ...
    (ceil(max(latSnr(:))) + abs(mean(latSnr)*0.01))];
lonGlims = [(floor(min(lonSnr(:))) - abs(mean(lonSnr)*0.01)) (ceil(max(lonSnr(:))) + abs(mean(lonSnr)*0.01))];

% Convert Cartesian constant SNR contours to geodetic
numSamples = 500;
lonVec = linspace(lonGlims(1),lonGlims(2),numSamples);
latVec = linspace(latGlims(1),latGlims(2),numSamples);
[lonG,latG] = meshgrid(lonVec,latVec);
snrs = [];
for ic = 1:numel(M)
    snrs = [snrs M(ic).SNR.*ones(size(M(ic).X))]; %#ok<AGROW>
end
[azC,~,rngC] = cart2sph(xC(:),yC(:),zeros(size(xC(:))));
[latSnr,lonSnr] = aer2geodetic(rad2deg(azC)-90,zeros(size(azC)),rngC,(txPosGeo(1)+rxPosGeo(1))/2,(txPosGeo(2)+rxPosGeo(2))/2,(txPosGeo(3) + rxPosGeo(3))/2,sph);
uC = unique([lonSnr(:) latSnr(:) snrs(:)],'rows','stable');
[lonG,latG,snrsIdeal] = griddata(uC(:,1),uC(:,2),uC(:,3),lonG,latG);
end
helperPlotScenario
function helperPlotScenario(hAxes,M,txPosGeo,rxPosGeo,ref,sph,cbarString)
% Helper plots the following:
%   - Transmitter and receiver positions
%   - Minimum SNR contour
%   - Range circles around ref (either 'transmitter' or 'receiver')

colorStr = 'k';

hold(hAxes,'on')

% Plot transmitter and receiver positions
hPTx = plot(txPosGeo(2),txPosGeo(1),['^' char(colorStr)],LineWidth=1.5);
hPRx = plot(rxPosGeo(2),rxPosGeo(1),['v' char(colorStr)],LineWidth=1.5);

% Range circles
rangeCircKm = (50:50:250); % Range (km)
azAngCirc = (0:359).';     % Azimuth angles (deg)

% Reference position for range circles
switch lower(ref)
    case 'receive'
        refPosGeo = rxPosGeo;
    otherwise
        refPosGeo = txPosGeo;

end

% Plot minimum SNR contour
for ic = 1:numel(M)
    [mAz,~,mRng] = cart2sph(M(ic).X,M(ic).Y,zeros(size(M(ic).X)));
    [lat,lon] = aer2geodetic(rad2deg(mAz)-90,zeros(size(mAz)),mRng,(txPosGeo(1)+rxPosGeo(1))/2,(txPosGeo(2)+rxPosGeo(2))/2,(txPosGeo(3) + rxPosGeo(3))/2,sph);
    h12 = plot(lon,lat,'--r',LineWidth=1.5);
    hold on
end

% Plot range circles
for ic = 1:numel(rangeCircKm)
    [latSnr,lonSnr] = aer2geodetic(azAngCirc,zeros(size(azAngCirc)),rangeCircKm(ic)*1e3, ...
        refPosGeo(1),refPosGeo(2),refPosGeo(3),sph);
    plot(lonSnr,latSnr,['--' char(colorStr)])
    text(lonSnr(1),latSnr(1),sprintf('%.0f km',rangeCircKm(ic)),FontWeight='bold',Color=colorStr);
end

% Labels
legend(hAxes,[hPTx hPRx h12],{'Transmitter','Receiver','Minimum SNR'});
xlabel(hAxes,'Longitude (deg)')
ylabel(hAxes,'Latitude (deg)')
axis(hAxes,'xy')
axis(hAxes,'tight')

% Add colorbar
hC = colorbar;
hC.Label.String = cbarString;
end
helperCalcTxAzPattern
function [txAzPatInterp,txAzAngInterp] = helperCalcTxAzPattern()
% Helper calculates the transmitter azimuth pattern for a typical
% communications system array. Plots patterns.
txAzAng = [0 7 25 40 70 100 115 130 160 190 205 220 250 280 295 310 340 360]; % Angles (deg)
txAzPat = [-2.3 -5 -1.5 -4.8 0 -4.8 -1.5 -4.8 0 -4.8 -1.5 -4.8 0 -4.8 -1.5 -4.8 0 -2.3]; % Pattern (dB)
txAzAngInterp = 0:360;
txAzPatInterp = interp1(txAzAng,txAzPat,txAzAngInterp,'pchip');
[txAzAngInterpWrap,idx] = sort(wrapTo180(txAzAngInterp));
txAzPatInterpWrap(idx) = txAzPatInterp;
figure
hAxes = axes;
plot(hAxes,txAzAngInterpWrap,txAzPatInterpWrap)
title(hAxes,'Transmitter Antenna Azimuth Pattern (dB)')
xlabel(hAxes,'Azimuth Angle (deg)')
ylabel(hAxes,'Magnitude (dB)')
grid(hAxes,'on')
axis(hAxes,'tight')
txAzPatInterp = db2mag(txAzPatInterp);
end
helperCalcTxElPattern
function [txElPatFill,txElAng] = helperCalcTxElPattern(numTxEl,txElTiltAng)
% Helper calculates the transmitter elevation pattern with and without
% null-filling for a typical communications system array. Plots patterns.

txElAng = -90:0.1:90;

% Calculate the array factor
AF = 0;
for n = 1:numTxEl
    AF = AF + exp(1i*pi*(n - 1)*sind(txElAng));
end
txElPat = abs(AF); % Magnitude
txElPatdB = mag2db(txElPat/max(txElPat(:)));

% Plot array factor
figure
hAxes = axes;
plot(hAxes,txElAng + txElTiltAng,txElPatdB,'--')
hold(hAxes,'on')

% Calculate roots
n = 1:(numTxEl/2 - 1);
thetan = [-asind(2*n/numTxEl) asind(2*n/numTxEl)];
wn = exp(1i*pi*sind(thetan));

% Calculate array factor with null filling
AF = 1;
w = exp(1i*pi*sind(txElAng));
epn = 1/numTxEl; % Fixed ratio to move the roots outside the unit circle
for n = 1:numel(wn)
    % Linear amplitude distribution to reduce ripples but maintain mainlobe
    % width
    an = -1/numTxEl*(n - 1) + 1;

    % Update array factor
    AF = an*AF.*(w - (1 + epn)*wn(n));
end

% Plot array factor with null filling
txElPatFill = abs(AF);
txElPatFilldB = mag2db(txElPatFill/max(txElPatFill(:)));
txElPatFill = db2mag(txElPatFilldB);
plot(txElAng + txElTiltAng,txElPatFilldB,'-',LineWidth=1.5);

% Plot tilt angle
xline(hAxes,txElTiltAng,'--k',LineWidth=1.5)

% Update axes
grid(hAxes,'on')
xlim(hAxes,[-30 30])
ylim(hAxes,[-30 10])

% Label
title(hAxes,'Transmitter Elevation Pattern (dB)')
xlabel(hAxes,'Elevation Angle (deg)')
ylabel(hAxes,'Magnitude (dB)')
legend(hAxes,'Pattern','Null-Filled Pattern','Tilt Angle')
end
helperSurfaceRelativePermittivity
function epsc = helperSurfaceRelativePermittivity(type,freq)
% Helper calculates the complex relative permittivity for the following
% soil types:
%   - 'loam'
%   - 'sily loam'
%   - 'silty clay'
%   - 'sandy loam'

T = 20;
waterContent = 0.5;
switch lower(char(type))
    case 'loam'
        sandPercentage = 41.96;
        clayPercentage = 8.53;
        specificGravity = 2.70;
        bulkDensity = 1.5781;
    case 'silty loam'
        sandPercentage = 30.63;
        clayPercentage = 13.48;
        specificGravity = 2.59;
        bulkDensity = 1.5750;
    case 'silty clay'
        sandPercentage = 5.02;
        clayPercentage = 47.38;
        specificGravity = 2.56;
        bulkDensity = 1.4758;
    otherwise
        sandPercentage = 51.52;
        clayPercentage = 13.42;
        specificGravity = 2.66;
        bulkDensity = 1.6006;
end
[~,~,epsc] = earthSurfacePermittivity('soil',freq,T, ...
    sandPercentage,clayPercentage,specificGravity,waterContent,bulkDensity);
end