Signal Upsampling and Imaging Artifacts
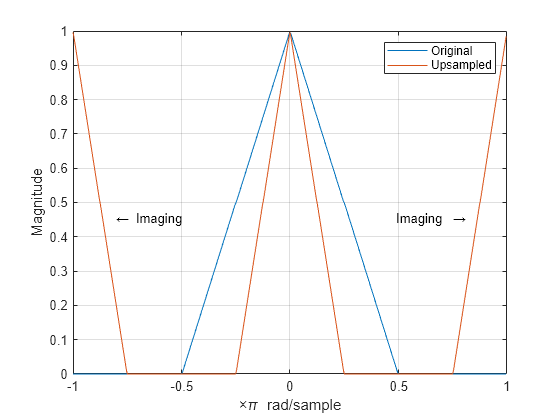
This example shows how to upsample a signal and how upsampling can result in images. Upsampling a signal contracts the spectrum. For example, upsampling a signal by 2 results in a contraction of the spectrum by a factor of 2. Because the spectrum of a discrete-time signal is -periodic, contraction can cause replicas of the spectrum normally outside of the baseband to appear inside the interval .
Create a discrete-time signal whose baseband spectral support is . Plot the magnitude spectrum.
f = [0 0.250 0.500 0.7500 1];
a = [1.0000 0.5000 0 0 0];

nf = 512;
b = fir2(nf-1,f,a);
Hx = fftshift(freqz(b,1,nf,"whole"));

omega = -pi:2*pi/nf:pi-2*pi/nf;
plot(omega/pi,abs(Hx))
grid
xlabel("\times\pi rad/sample")
ylabel("Magnitude")

Upsample the signal by 2. Plot the spectrum of the upsampled signal. The contraction of the spectrum has drawn subsequent periods of the spectrum into the interval .
y = upsample(b,2);
Hy = fftshift(freqz(y,1,nf,"whole"));

hold on
plot(omega/pi,abs(Hy))
hold off
legend("Original","Upsampled")
text(0.65*[-1 1],0.45*[1 1], ...
    ["\leftarrow Imaging" "Imaging \rightarrow"], ...
    HorizontalAlignment="center")
