Main Content

sbioensemblestats

Get statistics from ensemble run data

Syntax

[t,m] = sbioensemblestats(simDataObj)
[t,m,v] = sbioensemblestats(simDataObj)
[t,m,v,n] = sbioensemblestats(simDataObj)
[t,m,v,n] = sbioensemblestats(simDataObj,names)
[t,m,v,n] = sbioensemblestats(simDataObj,names,interpolation)

Arguments

t

Column vector of time points

mMatrix of mean values from the ensemble data. The number of rows in m is the length of the time vector t and the number of columns is equal to the number of species.
simDataObjA cell array of SimData objects, where each SimData object holds data for a separate simulation run. All elements of simDataObj must contain data for the same states in the same model. When the time vectors of the elements of simDataObj are not identical, simDataObj is first resampled onto a common time vector (see interpolation below).
vMatrix of variance obtained from the ensemble data. v has the same dimensions as m.
nCell array of character vectors for the quantity names whose mean and variance are returned in m and v, respectively. The number of elements in n is the same as the number of columns of m and v. The order of names in n corresponds to the order of columns of m and v.
namesCharacter vector, string, string vector, string array, or cell array of character vectors. names may include qualified names such as 'CompartmentName.SpeciesName' or 'ReactionName.ParameterName' to resolve ambiguities. If you specify empty {} or empty string array (string.empty) for names, sbioensemblestats returns statistics on all time courses contained in simDataObj.
interpolationCharacter vector or string denoting the interpolation method to use for resampling of the data onto a common time vector with the smallest simulation stop time. See resample for a list of interpolation methods. Default is 'linear'.

Description

[t,m] = sbioensemblestats(simDataObj) computes the time-dependent ensemble mean m of the ensemble data simDataObj. If the time vectors of the ensemble data are not identical, by default, the function uses the 'linear' interpolation method to resample the data onto the common time vector. See resample for a list of interpolation methods.

[t,m,v] = sbioensemblestats(simDataObj) also returns the variance v for the ensemble run data simDataObj.

[t,m,v,n] = sbioensemblestats(simDataObj) also returns the names of quantities n corresponding to the mean m and variance v columns. Each column of m or v describes the ensemble mean or variance of a quantity (or state) as a function of time.

[t,m,v,n] = sbioensemblestats(simDataObj,names) computes statistics only for the quantities specified by names.

[t,m,v,n] = sbioensemblestats(simDataObj,names,interpolation) uses the interpolation method interpolation to resample the simulation data to have a consistent time vector. If the time vectors of the ensemble data are not identical and if you do not specify any interpolation method, the function uses the 'linear' interpolation method by default.

Examples

collapse all

Load the radiodecay model.

sbioloadproject("radiodecay.sbproj");

Change the solver of the active configuration set to be ssa. Also, adjust the LogDecimation property on the SolverOptions property of the configuration set.

cs = getconfigset(m1,"active");
cs.SolverType = "ssa";
so = cs.SolverOptions;
so.LogDecimation = 10;

Perform an ensemble of 20 runs with no interpolation.

ensembleData = sbioensemblerun(m1,20);
sbioensembleplot(ensembleData, 'z', 1.0);

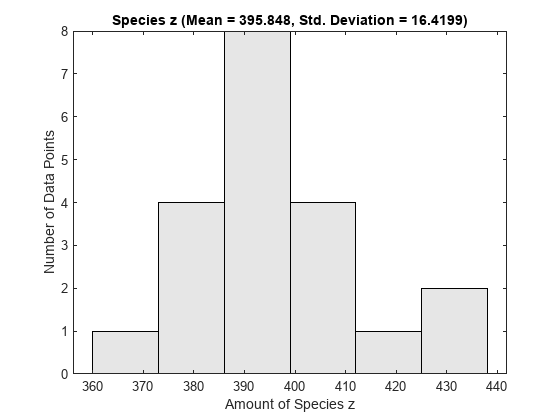
Figure contains an axes object. The axes object with title Species z (Mean = 395.848, Std. Deviation = 16.4199), xlabel Amount of Species z, ylabel Number of Data Points contains an object of type histogram.

Create a 2-D distribution plot of the species z at time = 1.0.

sbioensembleplot(ensembleData,"z",1.0); 

Figure contains an axes object. The axes object with title Species z (Mean = 395.848, Std. Deviation = 16.4199), xlabel Amount of Species z, ylabel Number of Data Points contains an object of type histogram.

Get ensemble statistics for all species using the default interpolation method.

[T,M,V] = sbioensemblestats(ensembleData);

Get ensemble statistics for a specific species using the default interpolation scheme.

[T2,M2,V2] = sbioensemblestats(ensembleData,"z");

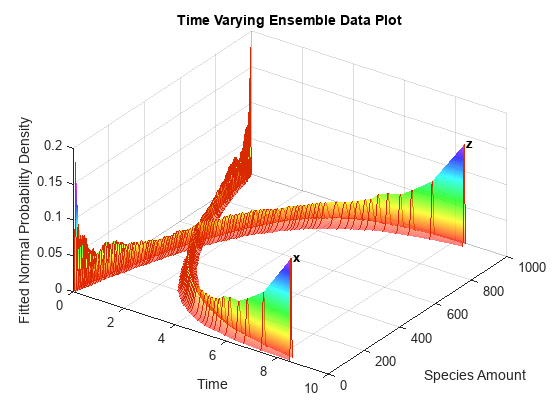
Create a 3-D shaded plot of the species x and z.

sbioensembleplot(ensembleData,["x","z"]);

Figure contains an axes object. The axes object with title Time Varying Ensemble Data Plot, xlabel Time, ylabel Species Amount contains 202 objects of type line, patch, text.

Version History

Introduced in R2006a