Main Content

LC Bandpass Pi

Model LC bandpass pi network

  • LC Bandpass Pi block

Libraries:
RF Blockset / Equivalent Baseband / Ladder Filters

Description

The LC Bandpass Pi block models the LC bandpass pi network described in the block dialog box, in terms of its frequency-dependent S-parameters.

For each inductor and capacitor pair in the network, the block first calculates the ABCD-parameters at each frequency contained in the vector of modeling frequencies. For each series pair, A = 1, B = Z, C = 0, and D = 1, where Z is the impedance of the series pair. For each shunt pair, A = 1, B = 0, C = Y, and D = 1, where Y is the admittance of the shunt pair.

The LC Bandpass Pi block then cascades the ABCD-parameters for each series and shunt pair at each of the modeling frequencies, and converts the cascaded parameters to S-parameters using the RF Toolbox™ abcd2s function.

See the Output Port block for information about determining the modeling frequencies.

The LC bandpass pi network object is a two-port network as shown in the following circuit diagram.
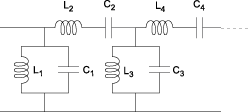
Two-port LC bandpass pi network

[L1, L2, L3, L4, ...] is the value of the 'L' property, and [C1, C2, C3, C4, ...] is the value of the 'C' property.

Parameters

expand all

Main

Vector containing the inductances, in order from source to load, of all inductors in the network. The inductance vector must contain at least three elements. All values must be strictly positive.

Vector containing the capacitances, in order from source to load, of all capacitors in the network. Its length must be equal to the length of the vector you provide in the Inductance parameter. All values must be strictly positive.

Visualization

Frequency data source, specified as User-specified.

Frequency data range, specified as a vector in hertz.

Reference impedance, specified as a nonnegative scalar in ohms.

Type of data plot to visualize using the given data, specified as one of the following:

  • X-Y plane — Generate a Cartesian plot of the data versus frequency. To create linear, semilog, or log-log plots, set the Y-axis scale and X-axis scale accordingly.

  • Composite data — Plot the composite data. For more information, see Create Plots Using Equivalent Baseband Library Blocks.

  • Polar plane — Generate a polar plot of the data. The block plots only the range of data corresponding to the specified frequencies.

  • Z smith chart, Y smith chart, and ZY smith chart — Generate a Smith® chart. The block plots only the range of data corresponding to the specified frequencies.

Type of parameters to plot based on the Plot type you set, specified as one of the following.

Plot typeY parameter1
X-Y planeS11, S12, S21, S22, GroupDelay, OIP3, NF, NFactor, and NTemp.
Composite dataNo Y parameter1 to set.
Polar planeS11, S12, S21, and S22
Z Smith chartS11 and S22.
Y Smith chartS11 and S22.
ZY smith chartS11 and S22.

Type of parameters to plot based on the Plot type you set, specified as one of the following.

Plot typeY parameter2
X-Y planeS11, S12, S21, S22, GroupDelay, OIP3, NF, NFactor, and NTemp.
Composite dataNo Y parameter2 to set.
Polar planeS11, S12, S21, and S22
Z Smith chartS11 and S22.
Y Smith chartS11 and S22.
ZY smith chartS11 and S22.

Plot format, specified as one of the following.

Y parameter1Y format1
S11, S12, S21, and S22.Magnitude (decibels), Magnitude (linear), Angle(degrees), Angle(radians), Real, and Imaginary.
GroupDelayns, us, ms, s, and ps.
OIP3dB, dBm, W, and mW.
NFMagnitude (decibels)
NFactorNone
NTempKelvin

Dependencies

To enable Y format1, set Plot type to X-Y plane.

Plot format, specified as one of the following.

Y parameter2Y format2
S11, S12, S21, and S22.Magnitude (decibels), Magnitude (linear), Angle(degrees), Angle(radians), Real, and Imaginary.
GroupDelayns, us, ms, s, and ps.
OIP3dB, dBm, W, and mW.
NFMagnitude (decibels)
NFactorNone
NTempKelvin

Dependencies

To enable Y format2, set Plot type to X-Y plane.

Frequency plot, specified as Freq.

Frequency plot format, specified as one of the following.

AutoHzkHzMHz
GHzTHz  

Y-axis scale, specified as Linear or Log.

Dependencies

To enable this parameter, set Plot type to X-Y plane.

X-axis scale, specified as Linear or Log.

Dependencies

To enable this parameter, set Plot type to X-Y plane.

Plot the specified data using the plot button.

References

[1] Ludwig, Reinhold and Pavel Bretchko. RF Circuit Design: Theory and Applications. Prentice-Hall, 2000.

[2] Zverev, Anatol I.Handbook of Filter Synthesis . John Wiley & Sons, 1967.

Version History

Introduced in R2013a