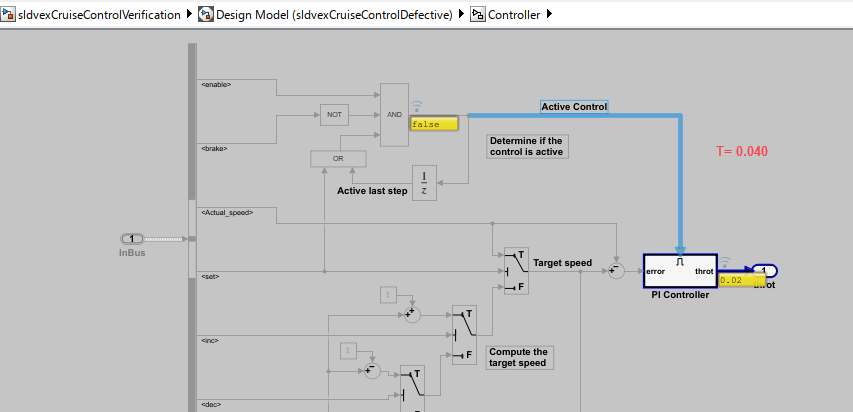
Debug Simulations in the Simulink Editor
Debug and analyze simulations in the model canvas, set breakpoints, step
through time steps and block execution
Using debugging tools available in the Simulink® Editor, you can:
Set breakpoints to pause a simulation at a point of interest.
View and manage breakpoints throughout your model.
Step through a simulation one time step at a time or one block at a time.
Add port value labels to signals to see how signal values change as you step through the simulation.
The model canvas shows breakpoints and port value labels in context within the block diagram so you can analyze, debug, and modify your model in one place.
Tools
| Breakpoints List | View, configure, and manage breakpoints for debugging models (Since R2022a) |
| Simulation Stepping Options | Enable stepping back and configure number of time steps to move when stepping through simulation |
| Simulation Pacing Options | Slow simulation to a specified ratio of simulation time to wall clock time |
Topics
Pause and Step in Simulation
- Step Through Simulations Using the Simulink Editor
Run simulations one or more time steps at a time or one block at a time, view signal values in the block diagram, and configure simulation stepping options. - Debug Simulation Using Signal Breakpoints
Set breakpoints to pause simulation at points of interest for debugging and analysis. - How Stepping Through Simulations Works
Learn how the software steps through time steps and how to evaluate trade offs involved in configuring the simulation stepping options. - Debug Simulation of Iterator Subsystem
Explore options for stepping through and debugging simulations of models that contain iterator subsystems.
View Information in the Block Diagram
- View Signal Values Using Port Value Labels
View signal values in the block diagram during simulation to understand, analyze, and debug your model. - Control and Display Execution Order
Determine the execution order among blocks within tasks. - View Sample Time Information
How to access sample time information interactively. - Use Connectors Tool to Visualize Relation Between Blocks
Use Connectors tool to visualize relation between Simulink functions and their function caller blocks, reader and writer blocks or blocks which execute based on events.
