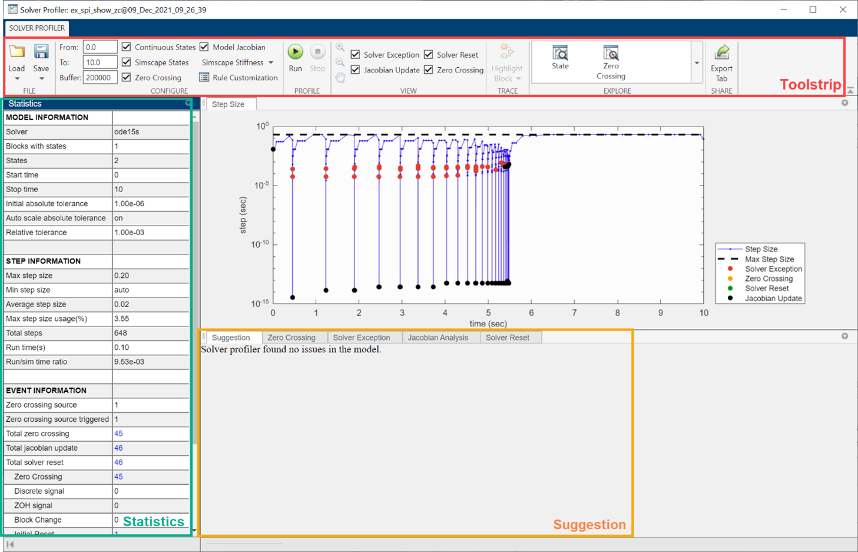
Solver Profiler Interface

The Solver Profiler enables you to:
Start a profiling session, save a session, or open a saved session.
Customize and filter the results displayed.
Interact with the model and trace and highlight the states that contain exceptions.
Open Simscape™ Explorer, Zero Crossing Explorer, or States Explorer to analyze simulation data further.
Customize profiler suggestions using your own rules.
The Solver Profiler includes four panes. Use these panes to perform these functions.
Toolstrip — Set parameters for the Solver Profiler to log and report events that occurred during simulation.
Step Size — Display step size over simulation time plot. You can also observe maximum step size and events such as Zero Crossing, Solver Reset or Solver Exception from the plot.
Statistics — Display statistical information on solver profiling including model information, step information and event information.
Suggestions — Provide suggestions to improve the performance of the current model. You can also obtain detailed profiling information from other tabs such as Zero Crossing, Solver Exception or Solver Reset.
Toolstrip
For more information on the Solver Profiler parameters, see Parameters.
Statistics Pane
The statistics pane displays information on model parameters, including:
Model Information — Model configurations for the current simulation including Solver type, states, time, tolerance.
Step Information
Average step size — A measure of how fast the solver advances. It is calculated as the total simulation time divided by the number of steps the solver used. It is bounded by the model configuration parameters Max step size and Min step size.
Max step size usage — The percentage of maximum step sizes used by the solver among all step sizes.
Event Information
Zero crossing — A solver-specific event that affects model dynamics. During simulation, the solver detects zero crossing. Zero crossing detection incurs computation cost. For more information, see Zero-Crossing Detection.
Solver reset — An event that causes the solver to reset its parameters. Solver reset detection incurs computation cost. The solver reset statistics are broken down into Zero Crossing, Discrete Signal, ZOH Signal, Block Change, Initial Reset, and Internal solver reset events. For more information, see Solver Resets
Solver exception — An event that renders the solver unable to solve model states to meet accuracy specifications. To solve model states accurately, the solver has to run a few adjusted trials, which incur computation cost.
Error control exception — An event where a solution obtained by the solver has an error that is greater than the tolerance specification.
Newton iteration exception — An event specific to implicit solvers. Newton iterations do not converge after a few trials.
Infinite state exception — An event where one or more states solved by the solver are infinite.
DAE newton iteration exception — An event specific to implicit solvers for Simscape models. The Newton iteration does not converge even though the solver violates the minimum step size constraint.
Suggestions Pane
The Suggestions pane provides suggestions if issues are detected in the model. It also provides detailed statistic data on events such as Zero Crossing, Solver Exception or Solver Reset. Clicking on these events in the Statistics Pane will bring relevant tabs in the Suggestion Pane to the front. The suggestions and exceptions pane displays information on exceptions, including:
Zero crossing — A solver-specific event that affects model dynamics. During simulation, the solver detects zero crossing. Zero crossing detection incurs computation cost. For more information, see Zero-Crossing Detection.
The Suggestions pane shows blocks that experience zero crossing events and number of those events that happened during simulation. To highlight the target block in the model, select the block from Zero Crossing table, then click Highlight Block from toolstrip.
Solver reset — An event that causes the solver to reset its parameters. Solver reset detection incurs computation cost. The solver reset statistics are broken down into Zero Crossing, Discrete Signal, ZOH Signal, Block Change, Initial Reset, and Internal solver reset events. For more information, see Solver Resets.
The suggestions pane shows detailed statistic data on solver reset events and blocks that caused the solver to reset. To highlight the target block in the model, select the block from Solver Reset table, then click Highlight Block from toolstrip.
Solver exception — An event that renders the solver unable to solve model states to meet accuracy specifications. To solve model states accurately, the solver has to run a few adjusted trials, which incur computation cost.
The suggestions pane shows detailed statistic data on solver exception events and blocks that caused solver exceptions. To highlight the target block in the model, Select the block from Solver Exception table, then click Highlight Block from toolstrip.