Analyze EIS Data on Single Particle Battery Cells Using Exact Linearization
R2026bThis example shows how to analyze electrochemical impedance spectroscopy (EIS) of a battery cell model designed using Simscape™ Battery™ software. You can use impedance analysis to measure the performance and realistic characteristics of a battery. For a battery modeled using the Battery Single Particle (Simscape Battery) block, you can analyze the impedance using the linearization tools from Simulink® Control Design™ software. In this example, you can batch linearize the model at 100% state of charge (SOC) and at different temperatures. Unlike the Analyze Battery Impedance Using Exact Linearization example, which uses Battery Equivalent Circuit (Simscape Battery) block, this example uses a parameter set for a 12.5 Ah NCA high energy pouch cell and a Battery Single Particle (Simscape Battery) block from Simscape™ Battery™.
Battery Model
The example model uses a Battery Single Particle block and discharges at different temperature levels at a constant current value.
mdl_linearize = "BatteryEISBatchLinearize";
open_system(mdl_linearize);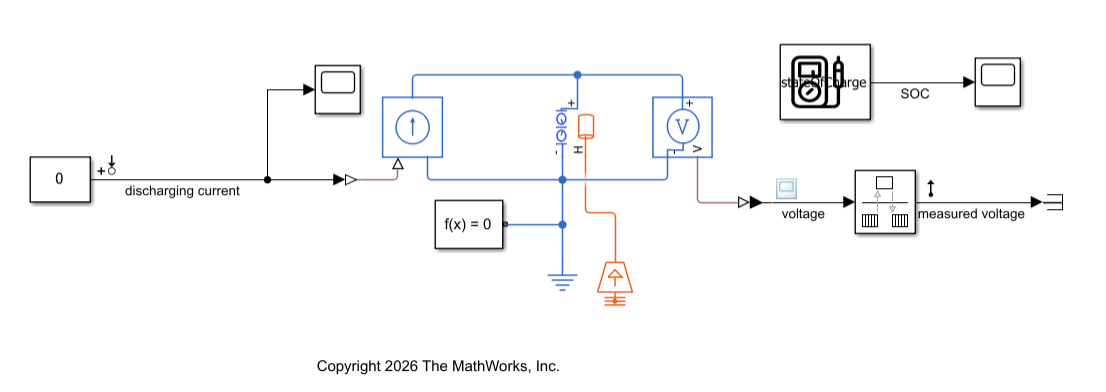
Compare Battery Cell Impedance at Different Temperature Levels
The battery cell is initialized at 100% SOC level. To specify the initial SOC level, set the initialSOC variable in ParameterSetScript.m, which is called when the model opens.
initialSOC
initialSOC =
1
Use the temp_ini variable to vary the cell temperature and perform the batch linearization.
temp_grid = 293.15:10:333.15;
params(1).Name = "temp_ini";
params(1).Value = temp_grid;
Conduct exact linearization at a snapshot time of 4.5 sec with different cell temperatures. Because the Simscape model has a high level of fidelity, it is challenging to initialize the battery cell at different temperatures. As a result, disable warning messages about initial condition convergence before batch linearization.
io = getlinio(mdl_linearize);
warning("off","physmod:simscape:engine:core:dae_errors:IcDiagnostics");
warning("off","physmod:simscape:engine:core:dae_errors:IcSolveFirstFallback");
lin_sys = linearize(mdl_linearize,io,4.5,params);
The batch linearization result is an array of state-space models that correspond to the temperature values. Recover the warning state after linearization.
warning("on","physmod:simscape:engine:core:dae_errors:IcDiagnostics");
warning("on","physmod:simscape:engine:core:dae_errors:IcSolveFirstFallback");
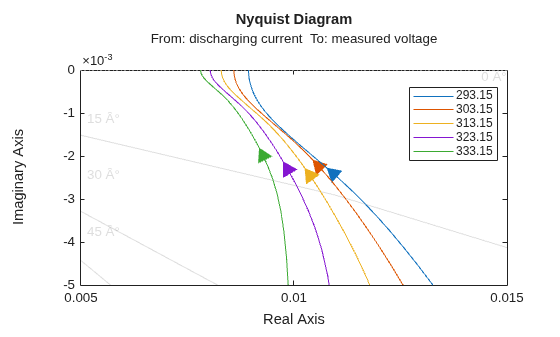
Show Impedance Features Using Nyquist Plots
Impedance features in the frequency domain can be translated to battery health indicators that supports aging analysis, diagnostics, and health tracking. Because of the noninvasive property of the technique, this impedance scanning approach enables faster insight generation about battery cells.
figure;
nyplot = nyquistplot(lin_sys(:,:,1,1),...
    lin_sys(:,:,2,1),...
    lin_sys(:,:,3,1),...
    lin_sys(:,:,4,1),...
    lin_sys(:,:,5,1),...
    logspace(-3,5,100));
nyplot.ShowNegativeFrequencies = "off";
axis equal
nyplot.XLimits = [0.005 0.015];
nyplot.YLimits = [-0.005 0];
legend(temp_grid,Location="best");
grid on
Create Frequency-Domain Impedance Object of Battery Cell
The nyquistplot command can only plot the EIS data in the fourth quadrant of the complex plane. According to the convention in battery engineering, the EIS data needs to be plotted in the first quadrant. To generate such a plot, create an frd object from the linearization result.
freqvector = logspace(-3,5,100);
impedanceFRD = frd(lin_sys(:,:,1,1),freqvector);
simRealZ = reshape(real(impedanceFRD.ResponseData),100,1);
simImagZ = -reshape(imag(impedanceFRD.ResponseData),100,1);
figure
plot(simRealZ,simImagZ,LineWidth=1.5);
grid on
title("EIS Data Curve at 100% SOC and 293.15 K")
xlabel("Real")
ylabel("Imaginary")
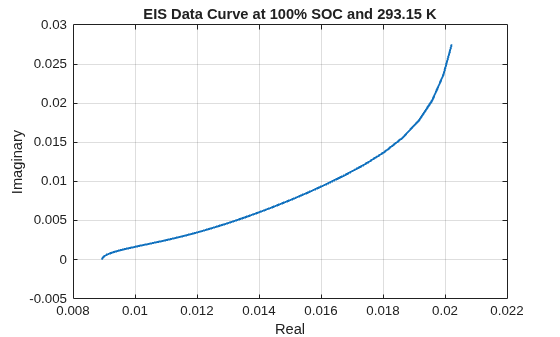
You can use the frd object to extract frequency-domain impedance features using Predictive Maintenance Toolbox™ features. The impedance features relate to the state of health (SOH) of battery cells, which is important in battery management systems.
References
[1] Jin N, Danilov DL, Van den Hof PMJ, Donkers MCF. Parameter estimation of an electrochemistry-based lithium-ion battery model using a two-step procedure and a parameter sensitivity analysis. Int J Energy Res. 2018;42:2417–2430. Licensed under the CC-BY-4.0 license, available at https://creativecommons.org/licenses/by/4.0/.

