Parameter Estimation with Simscape Models
R2026bIn this example, you estimate the parameters for a Simscape™ model consisting of a mass, spring, and damper, such that the model output matches the measured data, using the Parameter Estimator app. The model does not have any Simulink® signals. The example shows Simulink Design Optimization™ directly interacting with Simscape. For example, you can specify the position of the mass by clicking on the corresponding Simscape block.
Open the Simulink model.
open_system('sdoMassSpringDamperSimscape')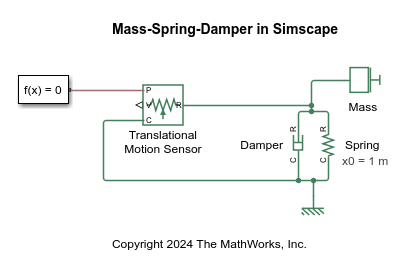
The mass is known to be 3.6 kg. The spring constant, k, and the damping coefficient, b, are unknown.
First explore whether the model output matches the measured data with nominal parameter values. Load the measured time and position of the mass.
load sdoMassSpringDamper_Data time position
To open the Parameter Estimator app, in the Simulink model window, in the Apps gallery, click Parameter Estimator.
Create a new experiment to associate the measured data with the position of the mass in the model. In the Parameter Estimation tab, click New Experiment. In the Edit Experiment: Exp dialog box, under the Outputs section, click Select Signals. In the model, click the Translational Motion Sensor block.
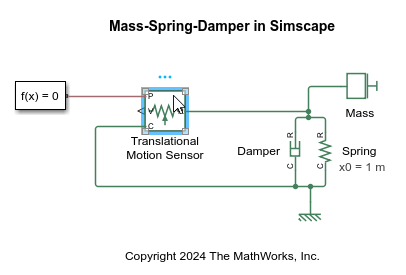
The Simscape variables for this block appear in the Select Outputs dialog box. Select the sensor position, P, and click OK.
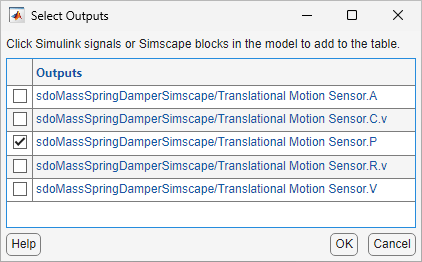
To associate the sensor position with the measured data, in the Edit Experiment: Exp dialog box, under the Outputs section, in the Time drop-down list, select time, and in the Data drop-down list, select position.
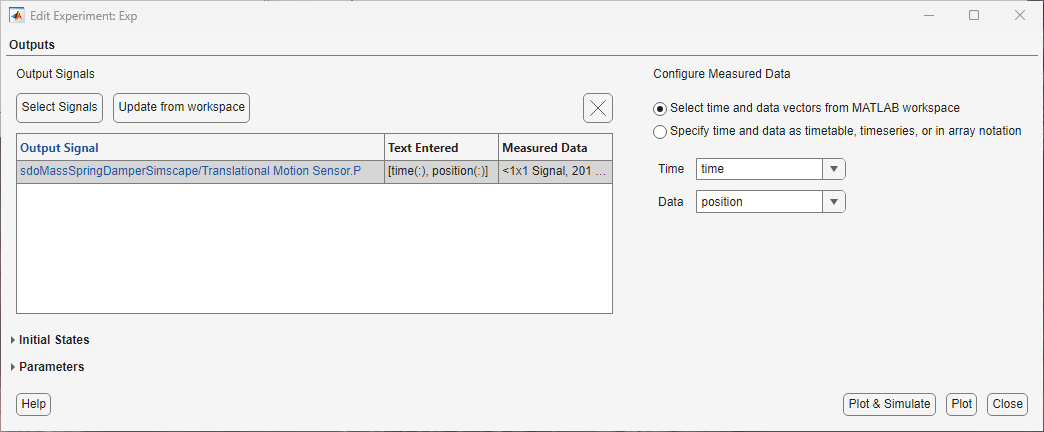
Click Plot & Simulate, and then click Close. You can see the experiment plot in the app. The experiment Exp appears in the Experiments section of the app.
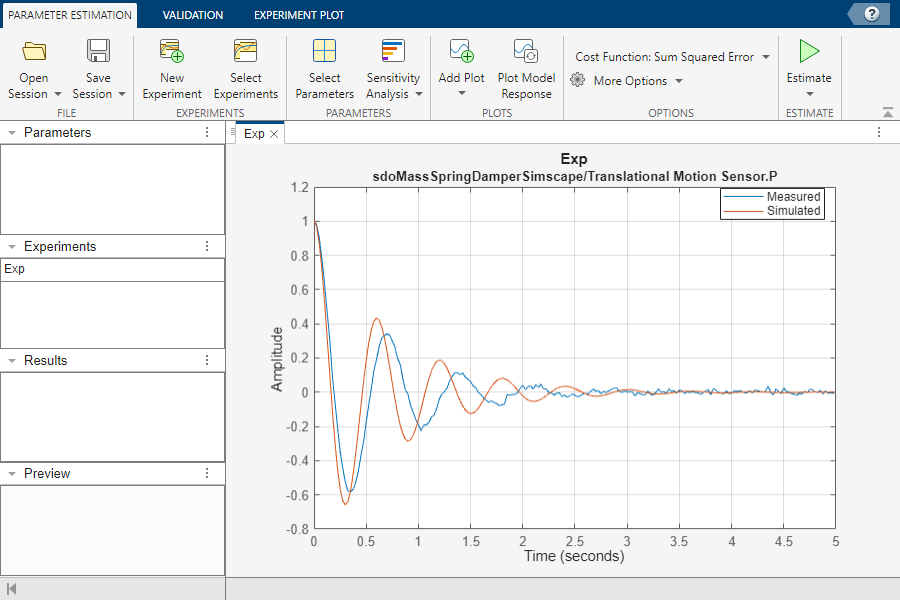
From the plot, you can observe that the model output does not match the measured data. So you need to estimate the parameters k and b.
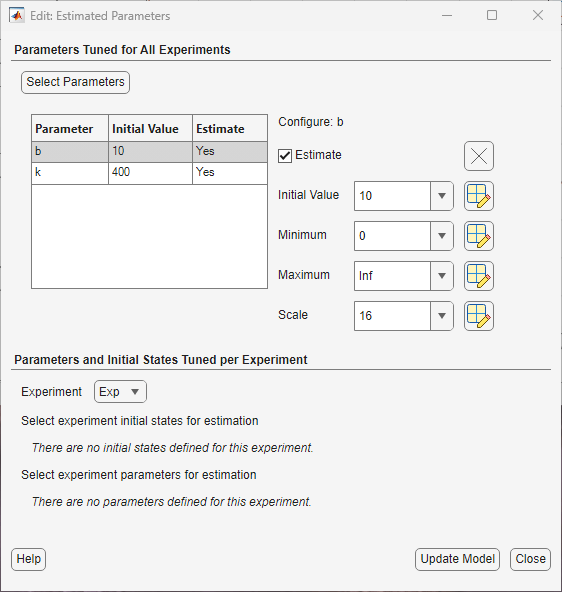
In the Parameter Estimation tab, click Select Parameters. In the Edit: Estimated Parameters dialog box, click Select Parameters. In the Select model variables dialog box, select the continuous variables b and k for estimation and click OK. Since these are physical parameters and cannot be negative, in the Edit: Estimated Parameters dialog box, set the Minimum value of both the parameters to 0. Click Close.
In the Parameter Estimation tab, in the Add Plot drop-down list, select Parameter Trajectory and Estimation Cost. Adjust the tabs of all the plots so that you can view them together.
In the Parameter Estimation tab, click Estimate. This varies the parameters over multiple iterations until there is a good fit between model output and measured data.
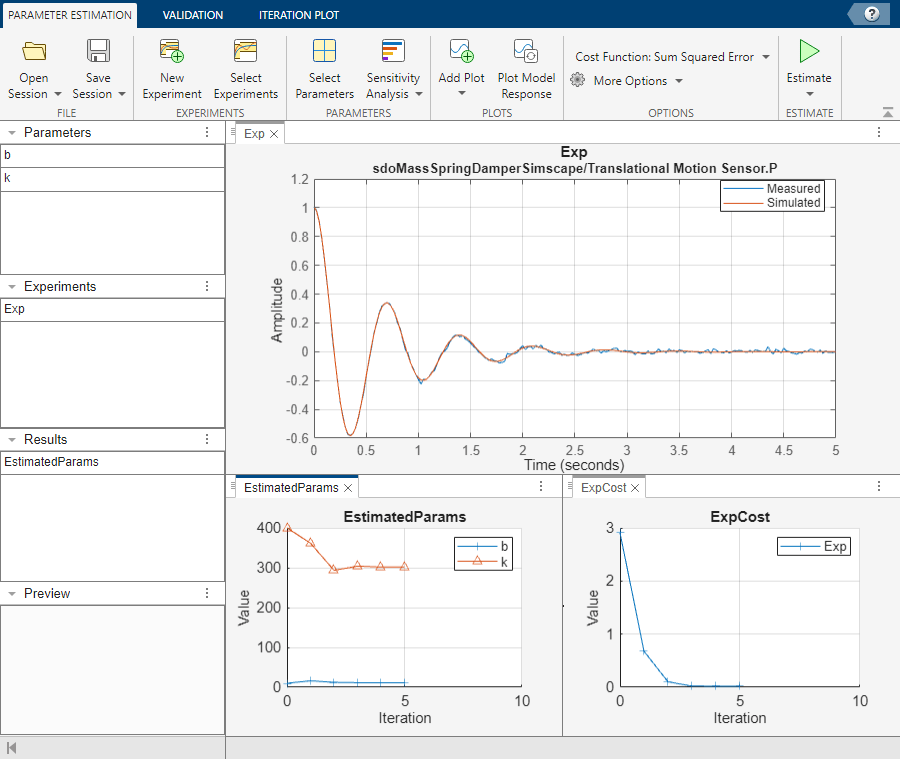
For convenience, the setup described up to this point along with the estimation results are saved in the sdoMassSpringDamperSimscape_spesession.mat session file. To open the session using the app, in the Parameter Estimation tab, click Open Session and select the session file. To view the updated model response using the estimated parameters, in the Parameter Estimation tab, click Select Parameters. In the Edit: Estimated Parameters dialog box, click Update Model. Then, in the Parameter Estimation tab, click Plot Model Response.
So in this example, you can see that Simulink Design Optimization directly interacts with Simscape when the measured data is associated with Simscape signals.

