Test Traffic Light Control by Using Logical and Temporal Assessments
This example shows how to use logical and temporal assessments to test the signal logic for a two-light traffic intersection. It also shows how to minimize untested results.
The model used in this example represents a controller in a two-light traffic intersection. The changes between the traffic light states depend on the traffic lights and the timing delay parameters defined in a Stateflow® chart. For more information about the Stateflow logic used in the model, see Model an Intersection of One-Way Streets (Stateflow).
Open and Run the Model
Open and simulate the model.
model = 'sltestTrafficLight';
open_system(model)
sim(model)
Plot the states of the two lights in the Simulation Data Inspector.
runData = Simulink.sdi.Run.getLatest;
LightState1 = getSignalsByName(runData,'Light1');
LightState2 = getSignalsByName(runData,'Light2');
Simulink.sdi.setSubPlotLayout(2,1);
plotOnSubPlot(LightState1,1,1,true);
plotOnSubPlot(LightState2,1,1,false);

plotOnSubPlot(LightState2,2,1,true);
plotOnSubPlot(LightState1,2,1,false);

Simulink.sdi.view
The traffic lights are approximately on opposite schedules. When one light is in the Green state, the other light is in the Red state, and vice versa. Additionally, the lights must pass through the Yellow state when transitioning from Green to Red.
To explore the Stateflow logic, consider:
Adding a breakpoint in one of the two atomic subcharts to step through the logic. For more information on debugging state charts, see Set Breakpoints to Debug Charts (Stateflow).
Inspecting the logic using the Sequence Viewer.
Visualizing different signals using the Simulation Data Inspector.
Requirements and Enumeration Types of the Model
To test the logic of the traffic controller, the Stateflow chart outputs an enumerated type that corresponds to the Red, Yellow, or Green state of the light. By default, Stateflow automatically generates the enumerated type definition. To create a custom enumeration definition, see Define State Activity Enumeration Type (Stateflow).
Simulating the model creates the built-in enumeration definition. To confirm that the enumerated type definition LightModeType exists, use which LightModeType.
Design Requirements
The test file in this example tests the traffic light model against several requirements:
The number of cars waiting at a light is always greater than or equal to zero.
At any point in time, at least one of the lights is red.
Every time the light becomes yellow, it stays yellow for a fixed amount of time within a tolerance value of 0.5 seconds before changing to red.
Every time the light becomes green, it stays green between a minimum and maximum time within a tolerance of 0.5 seconds before changing to yellow.
The test file tests the requirements by using a bounds check assessment, a custom assessment, and two trigger-response assessments. For more information about linking to requirements, see Link Temporal Assessments to Requirements.
Run the Logical and Temporal Assessments
Load the test file and open the test assessments in the Test Manager.
sltest.testmanager.load('test_traffic.mldatx');
sltest.testmanager.view;
Run the Bounds Check Test
Check whether the number of cars waiting at the light is always greater than or equal to zero by using a bounds check logical assessment. The symbol NumCars is mapped to the output of the Car_Monitor1 subsystem. The Car_Monitor1 subsystem outputs an int32 type, so the lower-bound expression is cast as int32(0). For more information about data type requirements, see Data Types in Assessment Conditions.
In the Test Manager, click
New Test Case 1in the Test Browser pane.Expand the Logical and Temporal Assessments section of the Test Manager.
Select Waiting Cars in the table and verify that its Assessment logic is correct.
In the upper right of the Visual Representation pane, click the Explore Pattern icon to open the Pattern Explorer.
View the Passing and Failing Examples. This image shows a passing example:

6. With the Waiting cars assessment selected, run the test case.
7. To view the results, expand the Results in the Results and Artifacts panel.
8. Select New Test Case 1 > Logical and Temporal Assessments > Waiting cars.
Run the Custom Logical Assessment
Compare the states of both lights at all time steps by using a custom logical assessment.
For safety reasons, at no point in time should both lights be green. In addition, other configurations are undesirable, such as one green light and one yellow light or two yellow lights. The assessment checks that one of the lights is always red.
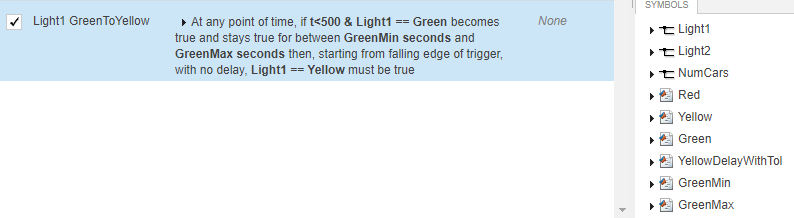
In the Logical and Temporal Assessments section, this assessment uses the symbols, Red and Yellow, which each correspond to their respective color in the enumerated type definition. For instance, the Expression field for the Red symbol references the Red enumeration member of the LightModeType enumeration - LightModeType.Red. The Green symbol appears as an unused symbol because it is not used until you implement the Green to Yellow assessment. See Create a Trigger-Response Assessment to Evaluate Green to Yellow Transitions.

Note that the Visual Representation preview is blank because it is only available for bounds check and trigger-response assessments. Also, the custom-expression field of the custom check must follow the syntax rules described in Logical and Temporal Assessment Conditions.
Return to the Test Browser pane and expand the Logical and Temporal Assessments section.
Select Both lights safety check.
Rerun the test case.
To view the results, expand the Results in the Results and Artifacts pane and select New Test Case 1 > Logical Temporal Assessments > Both lights safety check.
Run the Trigger Response Logical Assessment
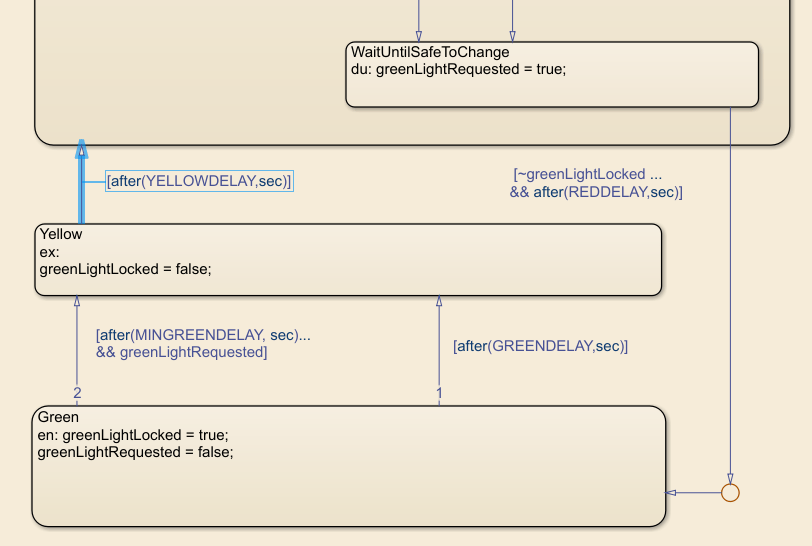
Use a trigger response logical assessment to assess the logic when Light1 transitions from the Yellow state to the Red state. The assessment triggers when Light1 enters the Yellow state. As shown in the Stateflow chart, for the after(YELLOWDELAY,sec) transitions in each atomic subchart, the state switches from Yellow to Red after a fixed delay of YELLOWDELAY seconds. To meet the requirements, the YELLOWDELAY value is adjusted by a tolerance value, tol for the assessment in the assessment callback.
Under Logical and Temporal Assessments, enable Light1 YellowToRed Transition assessment.
Verify its Assessment logic summary.
Expand the summary and the trigger section and set time-reference to
rising edge of trigger.Run the test case.
In the Results and Artifacts pane, click New Test Case 1 > Logical and Temporal Assessments > Light1 YellowToRed Transition.
Observe that the assessment fails.
The Expected Behavior and Actual Result graphs show the assessment failures and the Explanation section describes the failures. The failures occur at the four points when the assessment triggers. In Error 1 of 4, the trigger condition becomes true at t = 132.1 and the Explanation section explains that the test expected the response condition to be true at 132.1 seconds. This result contradicts the requirement that the light stay yellow for a fixed amount of time before changing to red. The assessment fails because the evaluation of the response is at the rising edge of the trigger. The Light1 == Red response should not be evaluated until the trigger is false.
In the Test Browser pane, adjust the time-reference to falling edge of trigger. This setting ensures that the Light1 == Red response evaluates only when Light1 is no longer yellow.
Rerun the test case. Now the assessment passes at the four points of the simulation where Light1 turns yellow. Additionally, there is a point marked at t = 984.5, which corresponds to the point after which the assessment can no longer be evaluated. The logic specifies that the trigger condition must stay true for most YellowDelayWithTol seconds, or 15.5 seconds. After t = 984.5, there is not enough time left in the simulation to accurately assess the logic.

You might notice similar behavior for other assessments based on the timing parameters supplied to the trigger.
You can reevaluate the assessments to minimize untested results.
Click New Test Case 1 in the current results.
At the bottom of the Property-Value pane in the lower left, enable Extended Assessment Result. The assessments are reevaluated and the results are updated.
The plot now shows that there are no untested results.

Create a Trigger-Response Assessment to Evaluate Green to Yellow Transitions
This assessment evaluates the Light1 transitions from Green to Yellow during the first half of simulation. The assessment triggers when the light changes from Red to Green. The transition from Green to Yellow occurs within a fixed window of time based on the greenLightRequested parameter. To set up the parameters and use the built-in symbol t to restrict the assessment to the first half of the simulation, create an assessment callback.
Set Up the Parameters
In the Test Manager, expand the Logical and Temporal Assessments section.
Click Add Assessment and choose Trigger-response.
Double click the Name field. Rename the assessment
Light1 GreenToYellow.Set the trigger condition. Click the drop-down next to the trigger field and select
becomes true and stays true for between. This logic is required because the light must stay green before switching to yellow. After you select the trigger type, the condition, min-time (sec), max-time (sec), and time-reference fields become visible.For condition, enter
t<500 & Light1 == Green. The assessment uses the built-in symboltto trigger a check whenLight1becomesGreenwithin the first 500 seconds of the simulation.For min-time (sec), enter
GreenMin.For max-time (sec), enter
GreenMax. Note thatGreenMinandGreenMaxare not yet defined and appear as Unresolved symbols in the Symbols pane.Set the time-reference to
falling edge of trigger, which ensures that the response whenLight1becomes yellow is evaluated only when Light1 is no longer green.Leave the delay as
with no delay.Set the response to
must be true. This option evaluates a single instance of time and captures whether the transition toYellowoccurs. After selecting the response type, the condition field becomes visible.For condition, enter
Light1 == Yellow.Resolve the
GreenMinandGreenMaxsymbols, by adding this assessment callback code to the existing code in the Assessment Callback. The callback extracts the Stateflow parameters that correspond to theGreentransition, then adjusts them by the tolerance value specified in the requirements to prepare them for themin-timeandmax-timetrigger fields.
greenMin = maskObj.getParameter('MINGREENDELAY');
greenMin = str2double(greenMin.Value);
greenMinAdj = greenMin - tol;

greenMax = maskObj.getParameter('GREENDELAY');
greenMax = str2double(greenMax.Value);
greenMaxAdj = greenMax + tol;
13. In Symbols, right-click the symbol name GreenMin and choose Map to expression.
14. In the Expression field, enter the variable name greenMinAdj.
15. Resolve the symbol GreenMax by repeating steps 13 and 14 by using greenMaxAdj for the expression.
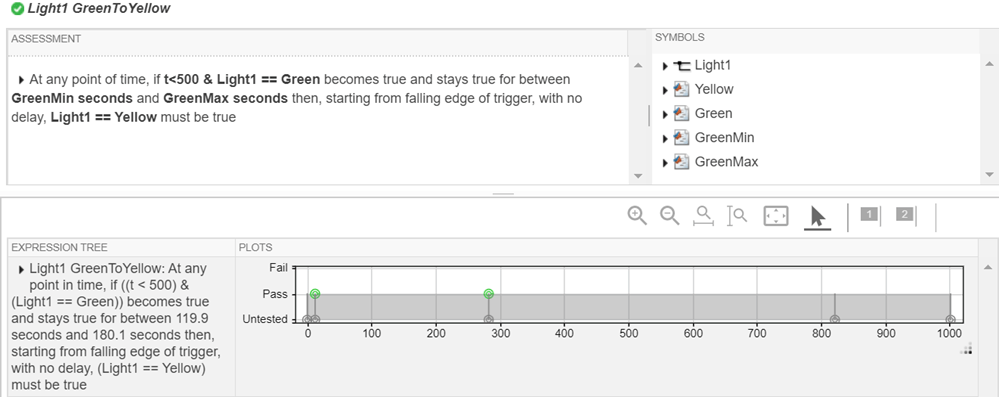
View the Light1 GreenToYellow Logic
Collapse the assessment to read a summary of its logic:
You can use the Visual Representation to preview the logic of the assessment. After Light1 turns green, it must stay green for a period of time within the minimum and maximum times. When the Light1 trigger is false and the light is no longer green, the Light1 trigger is true and the light changes to yellow.
Run the Assessment and View the Results
Run the assessment.
In the Results and Artifacts pane, expand New Test Case 1 > Logical and Temporal Assessments. Select Light1 GreenToYellow and observe that the assessment triggers twice in the first half of the simulation. The trigger times align with the initial Simulation Data Inspector results when Light1 enters the Green state at t = 12.1 and t = 282.2.