Plot Basic Voltage-Charge Characteristics of Battery Blocks
You can plot the basic voltage-charge characteristics of the Battery and Battery (Table-Based) blocks without building a complete model. Use the plots to explore the impact of your parameter choices on device characteristics. If you parameterize the block from a data sheet, you can compare your plots to the data sheet to check that you parameterized the block correctly. If you have a complete working model but do not know which manufactured part to use, you can compare your plots to data sheets to help you decide.
To plot the basic characteristics, double-click the block and, in the Utilities section, click the Plot button next to the OCV-SOC Curve parameter. (since R2026a)
Before R2026a:
If you are using a block in the Simscape > Electrical > Sources library, right-click the block and select Electrical > Basic Characteristics from the context menu.
If you are using a block in the Simscape > Battery > Cells library, right-click the block and select Battery > Basic Characteristics from the context menu.
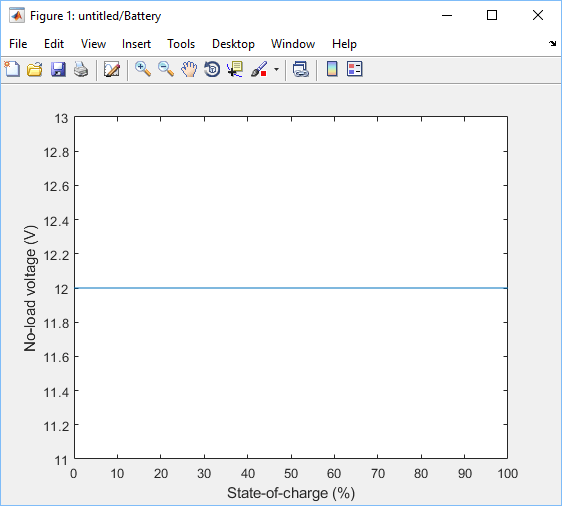
The software computes a set of bias conditions using the block parameter values and then opens a figure window containing a plot of no-load voltage versus the state of charge (SOC) for the block.
For example, clicking the Plot button next to the OCV-SOC Curve parameter generates this figure for the Battery block with default parameter values.
If you change the block parameter values and plot the characteristics again, the plot
opens in a new window. You can compare the plots side-by-side to see how the parameter
values affect the voltage-charge characteristics. For example, if you set the
Battery charge capacity parameter to
Finite and set the Self-discharge
parameter to Enabled, and then click the
Plot button next to the OCV-SOC Curve
parameter again, you generate this plot.

See Also
Battery | Battery (Table-Based)