Access Objects in Your Stateflow Chart
The objects in the Stateflow® API represent the graphical and nongraphical objects of a Stateflow chart. For example, the API objects Stateflow.State and Stateflow.Transition represent states
and transitions in a Stateflow chart. For more information, see Overview of the Stateflow API.
Find Objects in a Chart
With the find function, you can locate an
API object by specifying search criteria. You can combine criteria such as:
The type of object
The name of a property or function
A property name and value
For example, this command searches the Simulink.Root
object and returns every Stateflow.State object with the name
On:
onState = find(sfroot,"-isa","Stateflow.State",Name="On")
If more than one object meets the search criteria, find
returns an array of qualifying objects. For example, if more than one chart is open,
this command returns an array of Stateflow.Chart
objects:
chartArray = find(sfroot,"-isa","Stateflow.Chart")
Find Objects at Specific Levels of Containment
By default, the find function finds objects at all depths
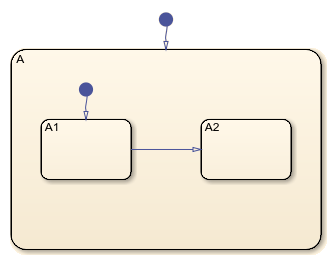
of containment within an object. For example, suppose that ch
is a Stateflow.Chart object that corresponds to this chart. The
chart contains a parent state A with two child states,
A1 and A2. For more information on
this example, see Create Charts by Using a MATLAB Script.

Calling the find function to find all the states in this
chart returns an array with three Stateflow.State
objects:
states = find(ch,"-isa","Stateflow.State");
get(states,"Name")
ans =

  3×1 cell array

    {'A'}
    {'A1'}
    {'A2'}
To limit the maximum containment depth of a search, use the
"-depth" argument as part of your search criteria. For
example, to find the only Stateflow.State object at the first
level of containment in ch,
enter:
sA = find(ch,"-isa","Stateflow.State","-depth",1);
sA.Name
ans =

    'A'
Similarly, you can call the find function to search for
states in the first level of containment in the Stateflow.State
object sA. In this case, the search includes the zeroth level
of containment, which is the searched object
itself:
states = find(sA,"-isa","Stateflow.State","-depth",1);
get(states,"Name")
ans =

  3×1 cell array

    {'A'}
    {'A1'}
    {'A2'}
To exclude state A from the search results, call the
MATLAB® function setdiff:
childStates = setdiff(states,sA);
get(childStates,"Name")
ans =
2×1 cell array
{'A1'}
{'A2'}Navigate the Stateflow Hierarchy
After you access an API object, you can use the getChildren and getParent functions to navigate
through the Stateflow hierarchy and identify the children that the object contains or the
parent that contains the object.
Find Child Objects
To find the children of an API object, call the
getChildren function. For instance, suppose that
ch is the Stateflow.Chart object that
corresponds to the chart in the previous example. Calling the
getChildren function on ch returns
an array that contains a Stateflow.State object and a
Stateflow.Transition
object.
children = getChildren(ch);
arrayfun(@class,children,UniformOutput=false)
ans =

  2×1 cell array

    {'Stateflow.State'     }
    {'Stateflow.Transition'}
The first element in the array is a Stateflow.State object
that corresponds to state
A.
state = children(1);
state.Name
ans =

    'A'
The second element in the array is a Stateflow.Transition
object that corresponds to the default transition into state
A.
children(2).Source
ans =

     []
children(2).Destination.Name
ans =

    'A'
Similarly, calling the getChildren function on the state
returns an array that contains two Stateflow.State objects and
two Stateflow.Transition objects.
grandchildren = getChildren(state);
arrayfun(@class,grandchildren,UniformOutput=false)
ans =

  4×1 cell array

    {'Stateflow.State'     }
    {'Stateflow.State'     }
    {'Stateflow.Transition'}
    {'Stateflow.Transition'}
The first and second elements in this array are
Stateflow.State objects that correspond to the states
A1 and
A2.
grandchildren(1).Name
ans =

    'A1'
grandchildren(2).Name
ans =

    'A2'
The third and fourth elements in grandchildren are
Stateflow.Transition objects that correspond to the
transitions into states A1 and between state
A1 and A2,
respectively.
grandchildren(3).Source
ans =

     []
grandchildren(3).Destination.Name
ans =

    'A1'
grandchildren(4).Source.Name
ans =

    'A1'
grandchildren(4).Destination.Name
ans =

    'A2'
Find Parent Object
To find the parent of an API object, call the getParent
function. For instance, suppose that sA1 is the
Stateflow.State object that corresponds to state
A1 in the previous example. Calling the
getParent function on sA1 returns
the Stateflow.State object that corresponds to state
A:
parent = getParent(sA1);
parent.Name
ans =

    'A'
Similarly, calling the getParent function on
parent returns the Stateflow.Chart
object that corresponds to the
chart:
grandparent = getParent(parent);
grandparent.Name
ans =

    'Chart'
Retrieve Recently Selected Objects
You can retrieve the most recently selected objects in a chart by calling the
sfgco function. This function
returns a single object or an array of objects, depending on your selection.
For instance, suppose that you select the transition from state
A1 to state A2 in the previous example.
Calling sfgco returns the corresponding Stateflow.Transition
object:
tr = sfgco;
str = str = "Transition from "+tr.Source.Name+" to "+tr.Destination.Name
str =

    "Transition from A1 to A2"
Similarly, if you simultaneously select the three states in the chart, calling
sfgco returns an array of Stateflow.State
objects.
states = sfgco;
get(states,"Name")
ans =
3×1 cell array
{'A'}
{'A1'}
{'A2'}Note
When you use sfgco to access multiple objects, the order
of the objects in the array depends on the order in which you select the
objects.