Count Events by Using the temporalCount Operator
This example shows how to use the temporalCount operator to count occurrences of explicit and implicit events. For more information, see Control Chart Execution by Using Temporal Logic.
Collect and Store Input Data in a Vector
The Stateflow® chart in this model collects and stores input data in a vector during simulation.
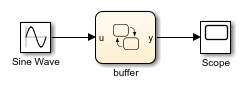
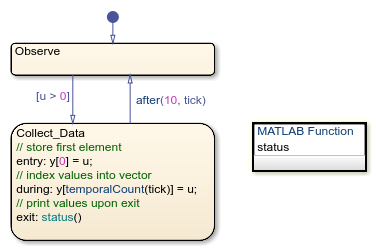
The chart contains two states and one MATLAB® function.
Simulate the Model
The execution of the chart consists of three stages.
Stage 1: Observation of Input Data
The chart wakes up and remains in the Observe state until the input data u is positive. Then, the transition to the state Collect_Data occurs.
Stage 2: Storage of Input Data
When the state Collect_Data becomes active, the value of the input data u is assigned to the first element of the vector y. While this state is active, each subsequent value of u is assigned to successive elements of y by using the temporalCount operator.
Stage 3: Display of Data Stored in the Vector
After the chart wakes up ten times, the data collection process ends. The chart calls the function status to display the vector data in the Diagnostic Viewer. Then, the chart takes the transition back to the state Observe.