Integrate MATLAB Functions in Stateflow Charts
You can use MATLAB® functions to implement complex algorithms in your Stateflow® charts. You can use MATLAB functions to:
Express mathematical calculations, proccess data, or analyze statistics.
Incorporate established MATLAB algorithms into your state machine.
Encapsulate complex logic to make the chart design cleaner.
For more information about creating MATLAB functions for use in Stateflow charts, see Reuse MATLAB Code by Defining MATLAB Functions.
Add MATLAB Functions to a Stateflow Chart
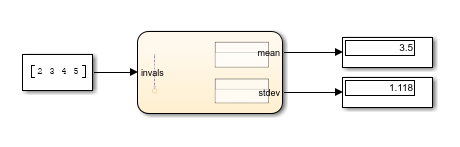
In this example, you build a model that contains two MATLAB functions and then use the functions to calculate the mean and standard deviation of data that you input to the chart.
Set Up the Model
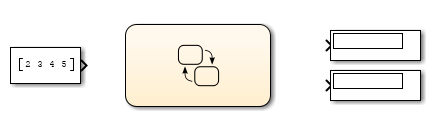
Create a new Simulink® model.
Add a Chart block, Constant block, and two Display blocks.
Set the value of the Constant block to [2 3 4 5].
Save the model as
call_stats_function_stateflow.
Configure the Stateflow Chart
Open the Chart block.
Add two MATLAB functions by using the MATLAB Function icon
 .
.Label the functions with these signatures:
meanout = meanstats(vals)stdevout = stdevstats(vals)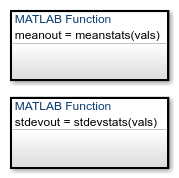
Add a default transition to a terminating junction with this condition action:
{
mean = meanstats(invals);
stdev = stdevstats(invals);
}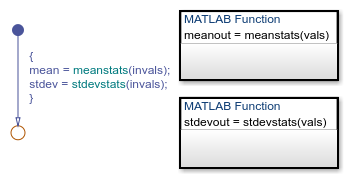
If the arguments of a function signature are scalars, check that the inputs and outputs of the function calls follow the rules of scalar expansion. For more information, see Assign Values to All Elements.
Define Data Elements
Open the Symbols pane.
Set the data types for these data by using the Type column::
invals: Input Datastdev: Output Datamean: Output Data

Program the Standard Deviation Function
Open the stdevstats function and add this code:
function stdevout = stdevstats(vals)
%#codegen

% Calculate standard deviation
len = length(vals);
stdevout = sqrt(sum(((vals-avg(vals,len)).^2))/len);

function meanfcn = avg(inputArray,inputSize)
    meanfcn = sum(inputArray)/inputSize;
The function sum computes the value of stdevout.
The %#codegen compilation directive helps detect compile-time
violations of syntax and semantics in MATLAB functions supported for code generation.
Program the Mean Function
Open the meanstats function and add this code:
function meanout = meanstats(vals)
%#codegen

% Calculate statistical mean
len = length(vals);
meanout = avg(vals,len);

% Plot results (simulation only)
coder.extrinsic("plot");
plot(vals,"-+");

function meanfcn = avg(inputArray,inputSize)
    meanfcn = sum(inputArray)/inputSize;
The length function supports code generation, and
returns the length of a vector. The function avg computes the value of
meanout. You define plot as extrinsic, because it
is not supported for code generation.
Simulate the Model
Connect the Simulink blocks to the chart input and output ports.
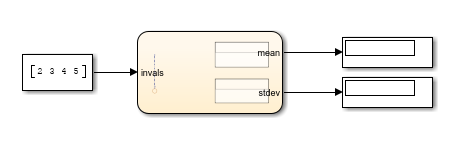
Click Run. The mean and standard deviation numbers appear in the Display blocks.
Generate Code from Charts That Use MATLAB Functions
To generate code, all functions must support code generation. If a function does not
support code generation, you can use coder.extrinsic (Simulink) to mark it as an exception. For a list of functions that
MATLAB supports for code generation, see Functions and Objects Supported for C/C++ Code Generation (MATLAB Coder).
See Also
coder.extrinsic (Simulink)