Main Content

copularnd

Copula random numbers

Description

example

u = copularnd('Gaussian',rho,n) returns n random vectors generated from a Gaussian copula with linear correlation parameters rho.

u = copularnd('t',rho,nu,n) returns n random vectors generated from a t copula with linear correlation parameters rho and degrees of freedom nu.

u = copularnd(family,alpha,n) returns n random vectors generated from a bivariate Archimedean copula that has the type specified by family and the scalar parameter alpha.

Examples

collapse all

Generate correlated random data from a beta distribution using a bivariate Gaussian copula with Kendall's tau rank correlation equal to -0.5.

Compute the linear correlation parameter from the rank correlation value.

rng default  % For reproducibility
tau = -0.5;
rho = copulaparam('Gaussian',tau)
rho = -0.7071

Use a Gaussian copula to generate a two-column matrix of dependent random values.

u = copularnd('gaussian',rho,100);

Each column contains 100 random values between 0 and 1, inclusive, sampled from a continuous uniform distribution.

Create a scatterhist plot to visualize the random numbers generated using the copula.

figure
scatterhist(u(:,1),u(:,2))

Figure contains an axes object. The axes object with xlabel x, ylabel y contains a line object which displays its values using only markers.

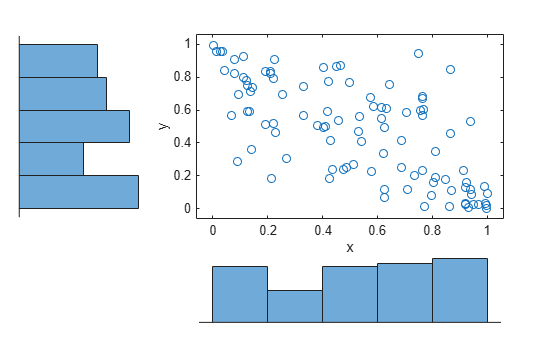
The histograms show that the data in each column of the copula has a marginal uniform distribution. The scatterplot shows that the data in the two columns is negatively correlated.

Use the inverse cdf function betainv to transform each column of the uniform marginal distributions into random numbers from a beta distribution. In the first column, the first shape parameter A is equal to 1, and a second shape parameter B is equal to 2. In the second column, the first shape parameter A is equal to 1.5, and a second shape parameter B is equal to 2.

b = [betainv(u(:,1),1,2), betainv(u(:,2),1.5,2)];

Create a scatterhist plot to visualize the correlated beta distribution data.

figure
scatterhist(b(:,1),b(:,2))

Figure contains an axes object. The axes object with xlabel x, ylabel y contains a line object which displays its values using only markers.

The histograms show the marginal beta distributions for each variable. The scatterplot shows the negative correlation.

Verify that the sample has a rank correlation approximately equal to the initial value for Kendall's tau.

tau_sample = corr(b,'type','kendall')
tau_sample = 2×2

    1.0000   -0.5135
   -0.5135    1.0000

The sample rank correlation of -0.5135 is approximately equal to the -0.5 initial value for tau.

Input Arguments

collapse all

Linear correlation parameters for the copula, specified as a scalar value or matrix of scalar values.

  • If rho is a p-by-p correlation matrix, then the output argument u is an n-by-p matrix.

  • If rho is a scalar correlation coefficient, then the output argument u is an n-by-2 matrix.

Data Types: single | double

Number of random vectors to return, specified as a positive scalar value.

  • If you specify the copula type as 'Gaussian' or 't', and rho is a p-by-p correlation matrix, then u is an n-by-p matrix.

  • If you specify the copula type as 'Gaussian' or 't', and rho is a scalar correlation coefficient, then u is an n-by-2 matrix.

  • If you specify the copula type as 'Clayton', 'Frank', or 'Gumbel', then u is an n-by-2 matrix.

Data Types: single | double

Degrees of freedom for the t copula, specified as a positive integer value.

Data Types: single | double

Bivariate Archimedean copula family, specified as one of the following.

'Clayton'Clayton copula
'Frank'Frank copula
'Gumbel'Gumbel copula

Bivariate Archimedean copula parameter, specified as a scalar value. Permitted values for alpha depend on the specified copula family.

Copula FamilyPermitted Alpha Values
'Clayton'[0,∞)
'Frank'(-∞,∞)
'Gumbel'[1,∞)

Data Types: single | double

Output Arguments

collapse all

Copula random numbers, returned as a matrix of scalar values. Each column of u is a sample from a Uniform(0,1) marginal distribution.

  • If you specify the copula type as 'Gaussian' or 't', and rho is a p-by-p correlation matrix, then u is an n-by-p matrix.

  • If you specify the copula type as 'Gaussian' or 't', and rho is a scalar correlation coefficient, then u is an n-by-2 matrix.

  • If you specify the copula type as 'Clayton', 'Frank', or 'Gumbel', then u is an n-by-2 matrix.

Version History

Introduced in R2006a