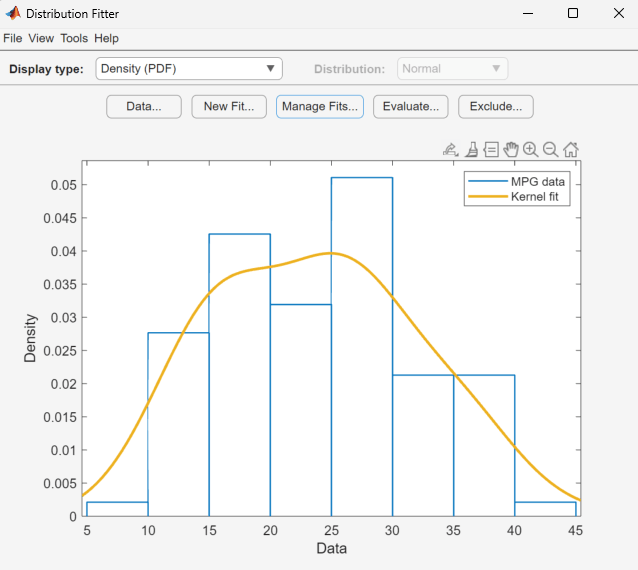
Fit a Distribution Using the Distribution Fitter App
R2026bThis example shows how you can use the Distribution Fitter app to interactively fit a probability distribution to data.
Step 1: Load Sample Data
Load the sample data.
load carsmallStep 2: Import Data
Open the Distribution Fitter app.
distributionFitter
To import the vector MPG into the Distribution
Fitter app, click the Data button. The Data dialog
box opens.
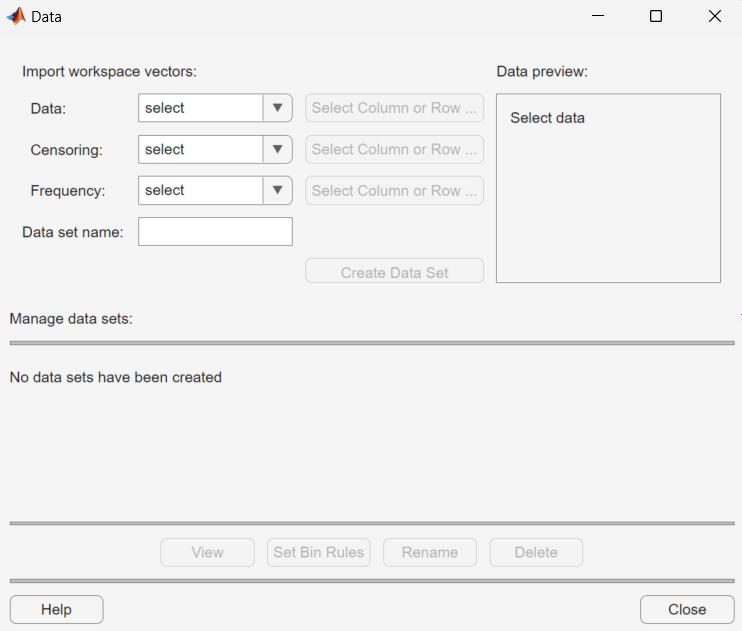
The Data field displays all numeric arrays in the MATLAB® workspace. From the list, select MPG. A histogram
of the selected data appears in the Data preview pane.
In the Data set name field, type
a name for the data set, such as MPG data, and
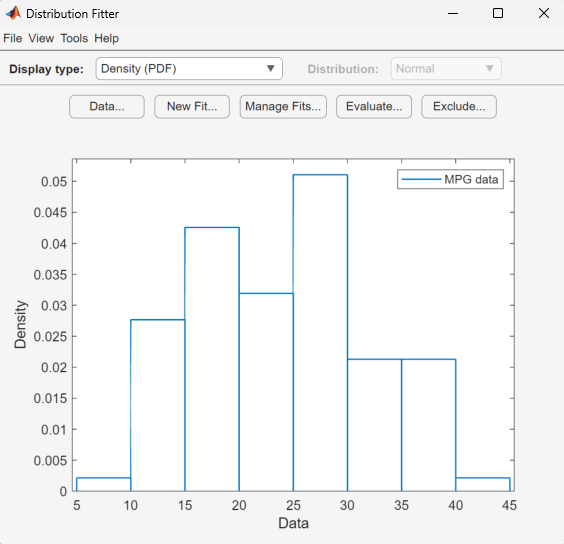
click Create Data Set. The main window of the
Distribution Fitter app now displays a larger version of the histogram
in the Data preview pane.
Step 3: Create a New Fit
To fit a distribution to the data, in the main window of the Distribution Fitter app, click New Fit.
To fit a normal distribution to MPG data:
In the Fit name field, enter a name for the fit, such as
My fit.From the list in the Data field, select
MPG data.Confirm that
Normalis selected from the Distribution list.Click Apply.
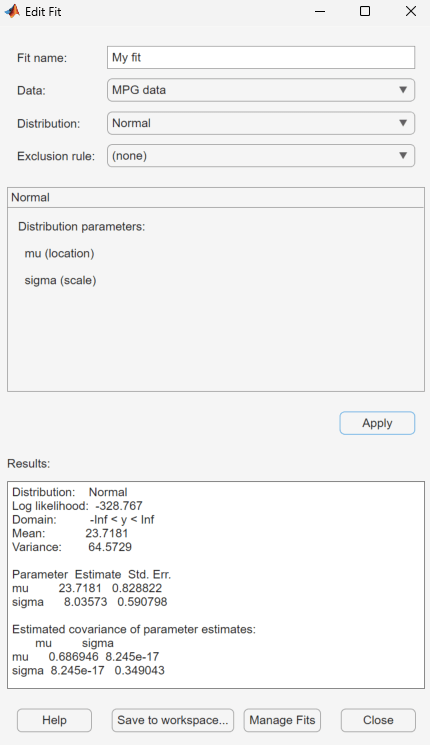
The Results pane displays the mean and
standard deviation of the normal distribution that best fits MPG
data.
The Distribution Fitter app main window displays a plot of the normal distribution with this mean and standard deviation.

Based on the plot, a normal distribution does not appear to provide a good fit for the
MPG
data
. To obtain a better evaluation, select
Probability plot from the Display
type list. Confirm that Normal is selected
from the Distribution list. The main window displays the
following figure.
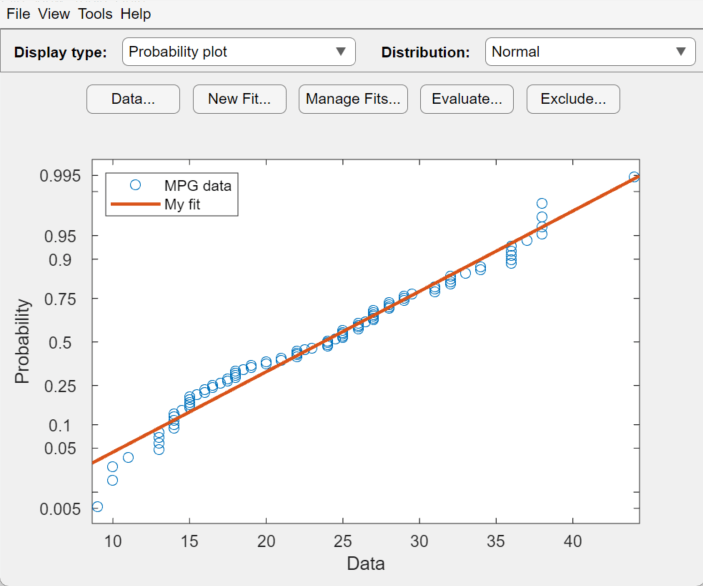
The normal probability plot shows that the data deviates from normal, especially in the tails.
Step 4: Create and Manage Additional Fits
The MPG data pdf indicates that the data
has two peaks. Try fitting a nonparametric kernel distribution to
obtain a better fit for this data.
Click Manage Fits. In the dialog box, click New Fit.
In the Fit name field, enter a name for the fit, such as
Kernel fit.Set Data to
MPG data.Set Distribution to
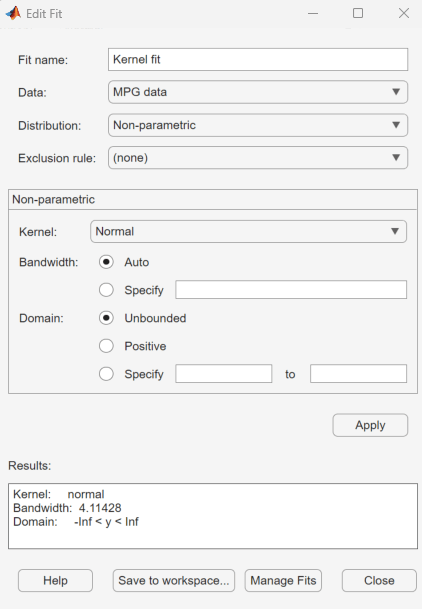
Non-parametric. This enables several options in the Non-parametric pane, including Kernel, Bandwidth, and Domain. For now, accept the default value to apply a normal kernel shape and automatically determine the kernel bandwidth (using Auto). For more information about nonparametric kernel distributions, see Kernel Distribution.Click Apply.
The Results pane displays the kernel type,
bandwidth, and domain of the nonparametric distribution fit to MPG
data.
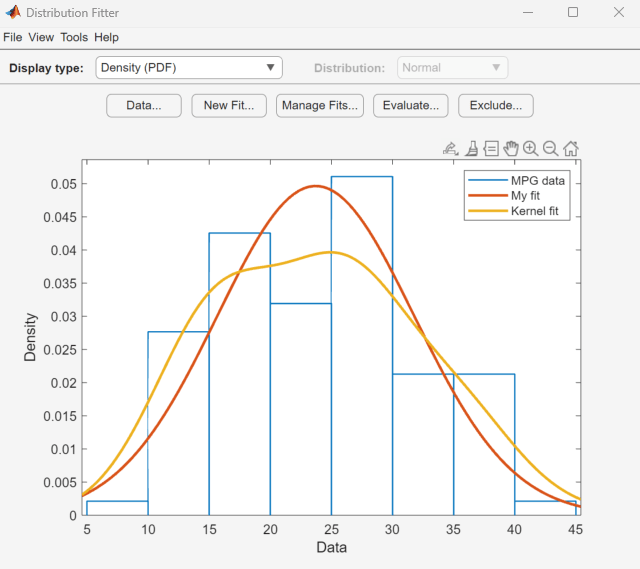
The main window displays plots of the original MPG data with the normal
distribution and nonparametric kernel distribution overlaid. To visually compare
these two fits, set Display type to Density
(PDF).
To include only the nonparametric kernel fit line (Kernel
fit) on the plot, click Manage Fits. In the Table
of fits pane, locate the row for the normal distribution
fit (My fit) and clear the box in the Plot column.