gname
Add case names to plot
Syntax
gname(cases)

gname

h = gname(cases,line_handle)
Description
gname(cases) displays a figure window and waits for
you to press a mouse button or a keyboard key. The input argument
cases is a character array, string array, or cell array of
character vectors, in which each row of the character array or each element of the
string array or cell array contains the case name of a point. Moving the mouse over the
graph displays a pair of cross-hairs. If you position the cross-hairs near a point with
the mouse and click once, the graph displays the label corresponding to that point.
Alternatively, you can click and drag the mouse to create a rectangle around several
points. When you release the mouse button, the graph displays the labels for all points
in the rectangle. Right-click a point to remove its label. When you are done labelling
points, press the Enter or Escape key to stop
labeling.
gname with no arguments labels each case
with its case number.
cases typically contains unique case names for each point, and is a string
array, cell array of character vectors, or character matrix with each row representing a
name. cases can also be any grouping variable, which
gname converts to labels.
h = gname(cases,line_handle) returns
a vector of handles to the text objects on the plot. Use the scalar line_handle to
identify the correct line if there is more than one line object on
the plot.
You can use gname to label plots created
by the plot, scatter, gscatter, plotmatrix, and gplotmatrix functions.
Examples
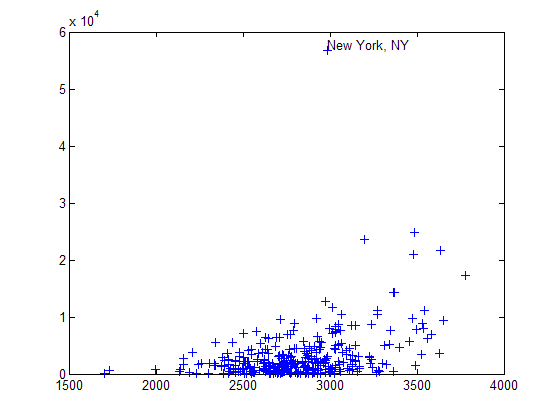
This example uses the city ratings data sets to find out which cities are the best and worst for education and the arts.
load cities
education = ratings(:,6);
arts = ratings(:,7);
plot(education,arts,'+')
gname(names)

Click the point at the top of the graph to display its label, “New York.”
Version History
Introduced before R2006a
See Also
gtext | gscatter | gplotmatrix