Train Regression Model Using Hyperparameter Optimization in Regression Learner App
R2026bThis example shows how to tune hyperparameters of a regression ensemble by using hyperparameter optimization in the Regression Learner app. Compare the test set performance of the trained optimizable ensemble to that of the best-performing preset ensemble model.
In the MATLAB® Command Window, load the
carbigdata set, and create a table containing most of the variables.load carbig cartable = table(Acceleration,Cylinders,Displacement, ... Horsepower,Model_Year,Weight,Origin,MPG);
Open Regression Learner using the
cartabletable and theMPGvariable as the response.regressionLearner(cartable,"MPG")In the Test section of the New Session from Arguments dialog box, select Set aside a percentage of data as test data and enter
15in the Percent set aside box.
To accept the options and continue, click Start Session.
Train all preset ensemble models. On the Learn tab, in the Model Presets section, click the arrow to open the gallery. In the Ensembles of Trees group, click All Ensembles. In the Train section, click Train All and select Train All. The app trains one of each ensemble model type, as well as the default fine tree model, and displays the models in the Models pane.
Note
If you have Parallel Computing Toolbox™, then the Use Parallel button is selected by default. After you click Train All and select Train All or Train Selected, the app opens a parallel pool of workers. During this time, you cannot interact with the software. After the pool opens, you can continue to interact with the app while models train in parallel.
If you do not have Parallel Computing Toolbox, then the Use Background Training check box in the Train All menu is selected by default. After you select an option to train models, the app opens a background pool. After the pool opens, you can continue to interact with the app while models train in the background.

The Models pane shows the validation RMSE for each model. Click the first ensemble model (2.1) to display a response plot. Blue points are true values, and yellow points are predicted values.
Note
Validation introduces some randomness into the results. Your model validation results can vary from the results shown in this example.
Select an optimizable ensemble model to train. On the Learn tab, in the Model Presets section, click the arrow to open the gallery. In the Ensembles of Trees group, click Optimizable Ensemble.
Select the model hyperparameters to optimize. In the Summary tab, you can select Optimize check boxes for the hyperparameters that you want to optimize. By default, all the check boxes are selected. For this example, accept the default selections.

Train the optimizable model. In the Train section of the Learn tab, click Train All and select Train Selected.
The app displays a Minimum MSE Plot during the optimization process. At each iteration, the app tries a different combination of hyperparameter values, and updates the plot with the minimum validation mean squared error (MSE) observed up to that iteration, indicated in dark blue. After completing the optimization process, the app selects the set of optimized hyperparameters, indicated by a red square in the plot. For more information, see Minimum MSE Plot.
The app lists the optimized hyperparameters in both the Best Point Hyperparameter Values section to the right of the plot and the Model Hyperparameters section of the model Summary tab. You can also click the red square in the plot to display the optimized hyperparameter values.

You can also display the optimization results in a table by selecting Table in the Show section to the right of the plot. The table highlights the best point iteration in dark orange and the minimum error iteration in light orange.
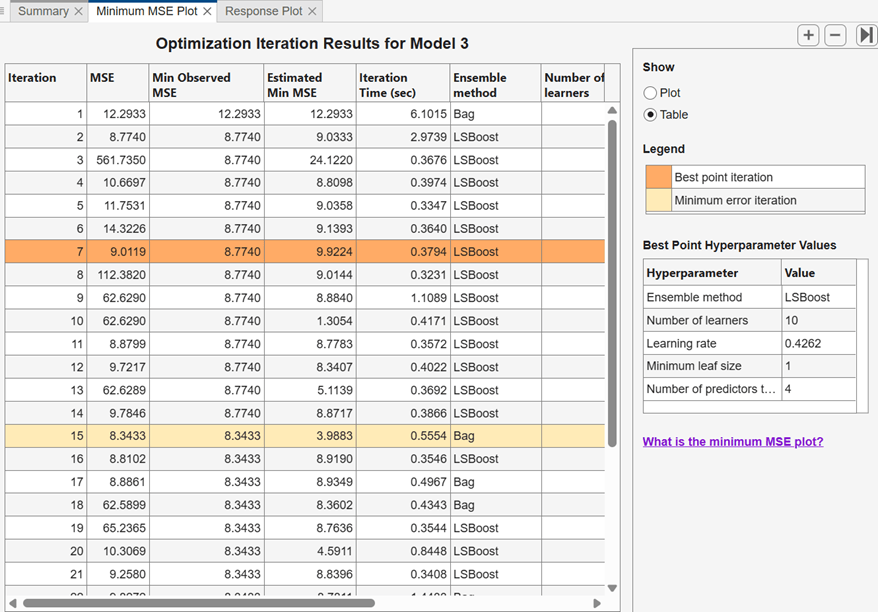
Note
In general, the optimization results are not reproducible.
Compare the trained preset ensemble models to the trained optimizable model. In the Models pane, the app highlights the lowest RMSE (Validation) (validation root mean squared error) by outlining it in a box. In this example, the trained optimizable ensemble outperforms the two preset models.
A trained optimizable model does not always have a lower RMSE than the trained preset models. If a trained optimizable model does not perform well, you can try to get better results by running the optimization for longer. On the Learn tab, in the Options section, click Optimizer. In the dialog box, increase the Iterations value. For example, you can double-click the default value of
30and enter a value of60. Then click Save and Apply. The options will be applied to future optimizable models created using the Model Presets gallery.Because hyperparameter tuning often leads to overfitted models, check the performance of the optimizable ensemble model on a test set and compare it to the performance of the best preset ensemble model. Use the data you reserved for testing when you imported data into the app.
First, in the Models pane, click the star icons next to the Bagged Trees model and the Optimizable Ensemble model.
For each model, select the model in the Models pane. In the Test section of the Test tab, click Test Selected. The app computes the test set performance of the model trained on the rest of the data, namely the training and validation data.
Sort the models based on the test set RMSE. In the Models pane, open the Sort by list and select
RMSE (Test).In this example, the trained optimizable ensemble still outperforms the trained preset model on the test set data. More importantly, the test set RMSE is comparable to the validation RMSE for the optimizable model.


