plot
Plot image view set views and connections
Description
plot( plots the views and connections
in the view set, vSet)vSet.
plot(
specifies options using one or more name-value arguments in addition to any combination of
arguments from previous syntaxes. For example,
vSet,Name=Value)plot(vSet,ShowViewIds="off") turns off the ID display.
Examples
Create an empty image view set.
vSet = imageviewset;
Define three relative poses.
relPoses = repelem(rigidtform3d,3,1);
relPoses(1).Translation = [3 0 0];
relPoses(2).Translation = [5 0 0];
relPoses(3).Translation = [2 0 0];
Calculate and add absolute poses.
absPoses = repelem(rigidtform3d,4,1);
absPoses(2).A = absPoses(1).A*relPoses(1).A;
absPoses(3).A = absPoses(2).A*relPoses(2).A;
absPoses(4).A = absPoses(3).A*relPoses(3).A;
Add four views to the image view set.
vSet = addView(vSet,1,absPoses(1));
vSet = addView(vSet,2,absPoses(2));
vSet = addView(vSet,3,absPoses(3));
vSet = addView(vSet,4,absPoses(4));
Add connections between the added views.
vSet = addConnection(vSet,1,2,relPoses(1));
vSet = addConnection(vSet,2,3,relPoses(2));
vSet = addConnection(vSet,3,4,relPoses(3));
Plot the view set with view identifers.
plot(vSet,ShowViewIds="on")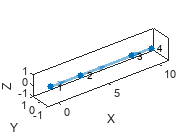
Input Arguments
Name-Value Arguments
Output Arguments
Version History
Introduced in R2020a