plot
Plot detected feature points
Description
plot( plots detected feature
points in the current axis. The input points)points is a feature point
object that stores the locations and related information of the detected
features.
plot(
specifies options using one or more name-value arguments in addition to any
combination of arguments from previous syntaxes. For example,
points,ax,Name=Value)plot(ShowOrientation=true) renders the orientation in the
display plot.
Examples
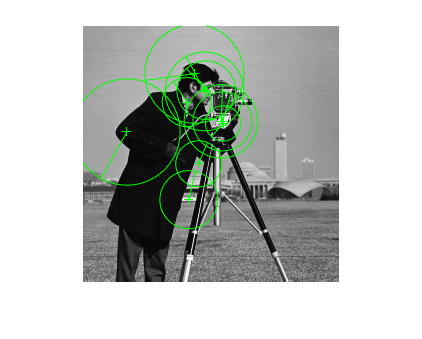
Read an image.
I = imread("cameraman.tif");Detect KAZE points from the image.
points = detectKAZEFeatures(I);
Extract KAZE features from the detected points.
[features,valid_points] = extractFeatures(I,points);
Plot the 10 strongest points and show their orientations.
imshow(I)
hold on
strongestPoints = selectStrongest(valid_points,10);
plot(strongestPoints,showOrientation=true)
hold off
I = imread("cameraman.tif");
points = detectSURFFeatures(I);
[features, valid_points] = extractFeatures(I,points);
Visualize 10 strongest SURF features, including their scales and orientation which were determined during the descriptor extraction process.
imshow(I);
hold on;
strongestPoints = valid_points.selectStrongest(10);
strongestPoints.plot("showOrientation",true);

Input Arguments
Name-Value Arguments
Version History
Introduced in R2011b