Capture Observability Metrics for MATLAB Web App Server
R2026bYou can capture, view, and export observability metrics from MATLAB® Web App Server™. These metrics can provide insights into server status, application performance, historical usage, and worker availability.
You can export telemetry data using OpenTelemetry Protocol (OTLP) and integrate it with monitoring tools such as Prometheus® or Grafana® for real-time visualization and analysis.
Prerequisites
If you use the
otlpmetrics type, configure an OpenTelemetry-compatible endpoint to receive metrics data.
Observability Metrics
If you enable capturing metrics on the server, the server logs the following metrics:
| Metric | Description | Type | Labels |
|---|---|---|---|
matlabwebappserver_app_launched_total | Total number of web app launch requests | Counter |
|
matlabwebappserver_app_launched_succeed_total | Total number of web apps launched successfully | Counter |
|
matlabwebappserver_idle_sessions | Number of prewarmed sessions available and waiting to serve requests | Gauge | — |
matlabwebappserver_sessions_in_use | Number of sessions currently serving a user | Gauge | — |
| Number of active sessions per application | Gauge |
|
matlabwebappserver_app_start_duration_seconds | Number of seconds taken to launch a web app | Histogram |
|
matlabwebappserver_authentication_failed_total | Total number of failed authentication requests | Counter |
|
Enable Metrics Capturing
By default, MATLAB
Web App Server does not capture any metrics. Enable capturing metrics by using the webapps-config
system command to set the following keys:
metrics_type
off(default): Do not capture metrics.otlp: Export metrics to an OTLP HTTP endpoint (for example, Grafana) using theOpenTelemetryprotocol. This option requires a destination endpoint.
metrics_destination
HTTP endpoint URL for the metrics receiver. This parameter is required only if you configure the metrics type as
otlp.
For example, enable OTLP output to the HTTP endpoint
https://opentelemetry-collector.observability.svc.cluster.local:4318/v1/metrics.
webapps-config set metrics_type otlp
webapps-config set metrics_destination "https://opentelemetry-collector.observability.svc.cluster.local:4318/v1/metrics"
The following is an example of the raw metric data structure exported by the server.
{
  scope name    : mw_webappserver
  schema url    :
  version       :
  start time    : 10/7/2025 7:24:01 PM
  end time      : 10/7/2025 7:24:31 PM
  instrument name       : matlabwebappserver_sessions_in_use
  description   : Current Active Sessions
  unit          :
  type     : LastValuePointData
  timestamp     : 1759865071308301700
  valid     : true
  value     : 0
  attributes            :
  resources     :
        service.name: MATLAB WebApp Server
        telemetry.sdk.language: cpp
        telemetry.sdk.name: opentelemetry
        telemetry.sdk.version: 1.19.0
  start time    : 10/7/2025 7:24:01 PM
  end time      : 10/7/2025 7:24:31 PM
  instrument name       : matlabwebappserver_idle_sessions
  description   : Number of prewarmed sessions available and waiting to serve requests
  unit          :
  type     : LastValuePointData
  timestamp     : 1759865071308294900
  valid     : true
  value     : 11
  attributes            :
  resources     :
        service.name: MATLAB WebApp Server
        telemetry.sdk.language: cpp
        telemetry.sdk.name: opentelemetry
        telemetry.sdk.version: 1.19.0
}
View Metrics Data
You can export telemetry data to a data dashboard with an OTLP endpoint.
Export Metrics Data to Dashboard
You can export telemetry data to a data dashboard such as Grafana to set up alerts and analyze trends. To export data, ensure that your services are configured with an OTLP endpoint to receive telemetry data.
If you configure the metrics type as otlp and specify a
destination OTLP endpoint, MATLAB
Web App Server exports metrics to the provided endpoint. Once you integrate the received
data, your dashboard displays real-time metrics from the server.
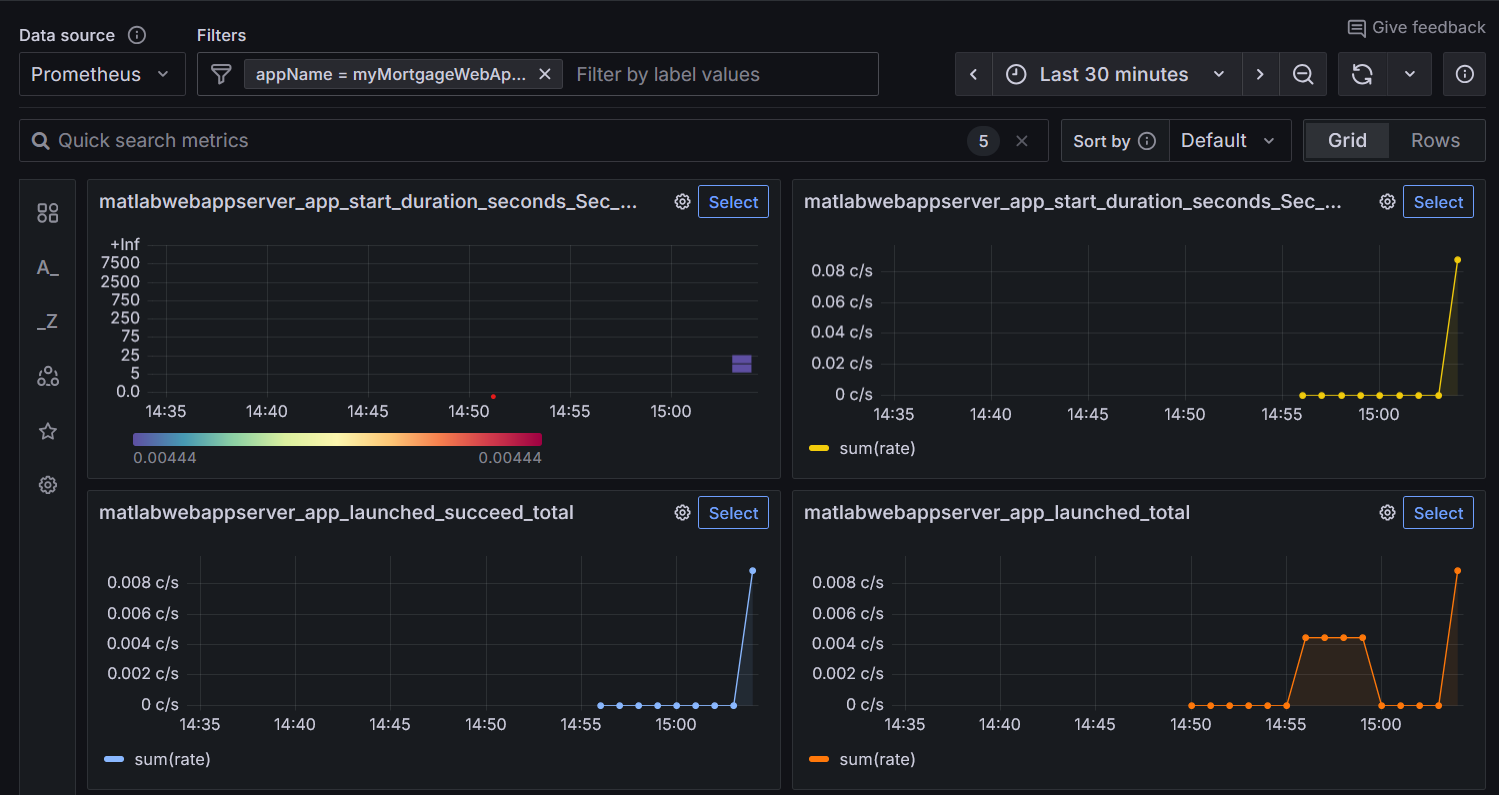
The following figure shows a sample Grafana panel visualizing server metrics.